Side by Side Histogram Help
Home » SPC for Excel Help » Statistical Tools » Miscellaneous Tools Help » Side by Side Histogram Help
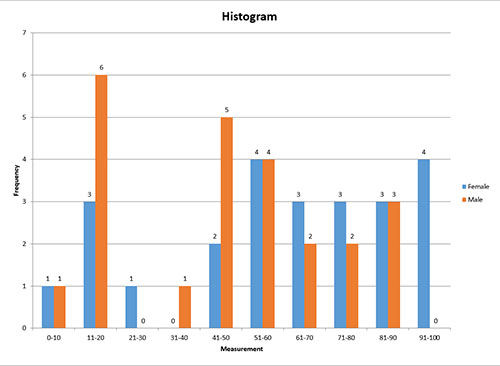
A side by side histogram is used to compare results. For example, you may have done a survey where respondents gave a rating between 0 and 100 for a product. You want to visually compare the responses by males and by females. An example of a side by side histogram is shown above. The steps in constructing a side by side histogram are given below.

- 1. Enter the data into a worksheet. The data can be downloaded at this link. You have two options for entering the data.
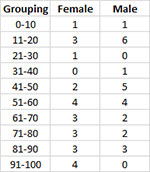
Option 1: The data are already summarized by groups. In this example, you have grouped the items based on ratings in sizes of 10 as shown below.
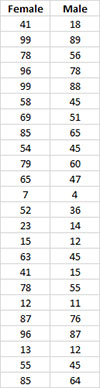
Option 2: The raw data are listed in columns based on how you want to view the data (in this case, male and female) as shown below.
- 2. Select all the data in the table above including the headings.
- 3. Select “Misc. Tools” from the “Statistical Tools” panel on the SPC for Excel ribbon.
- 4. Select the “Side-by-Side Histogram” option and then OK.
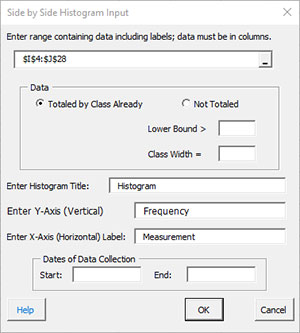
- Data Range: enter the range containing data; the default value is the range selected on the worksheet.
- Data: there are the two options for data setup as shown above; select the one you are using:
- Totaled by Class Already: the data have already be summed by class.
- Not Totaled: the data have not been totaled.
- Lower Bound >: this value gives the starting point for the histogram; for example, if you enter 0 here, the first class will involve values greater than 0 to the class width.
- Class Width =: this is the width of one class.
- Histogram Title: enter the title that will appear on the chart; the default title is “Histogram.”
- Y-Axis (Vertical Label): enter the label for the y axis; the default value is “Frequency.
- X-Axis (Horizontal Label): enter the label for the x axis; the default value is “Measurement.”
- Dates of Data Collection: enter the dates of data collection; optional, if printed will appear in the lower left-hand corner of the chart.
- Select OK to generate the results.
- Select Cancel to end the program.
Side by Side Histogram Output
The program adds a new sheet with the side by side histogram as shown below.