One Sample Sign Test Help
Home » SPC for Excel Help » Statistical Tools » Nonparametric Tests Help » One Sample Sign Test Help
The One Sample Sign Test method is based on collecting a number of samples from a population with unknown median, m. The median is used in place of the average because the median is a better measure of the central tendency of the data than the average for non-normal data. The example below shows how to do this test using the SPC for Excel software.

Example (from Statistics and Data Analysis, by Ajit Tamhane and Dorothy Dunlop, Prentice-Hall, 2000)
A thermostat is used in an electrical device to check to the accuracy of the design setting of 200 °F. Ten thermostats were tested to determine their actual settings. The results are given below.
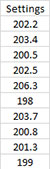
202.2, 203.4, 200.5, 202.5, 206.3, 198.0, 203.7, 200.8, 201.3, 199.0
We want to use these results to see if the median setting is significantly different from the design setting of 200.
- 1. Enter the results into an Excel worksheet as shown below. The data can be downloaded at this link.
- 2. Select the data including the heading.
- 3. Select “NonParametric” from the “Statistical Tools” panel on the SPC for Excel ribbon.
- 4. Select the “One Sample Sign Test” option and then OK.
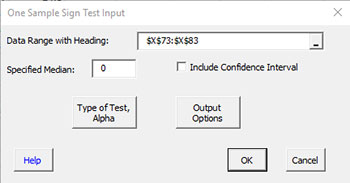
- Data Range with Heading: enter the range containing the data with headings default is the range selected on the worksheet.
- Specified Median: enter the specified median; 0 is the default.
- Include Confidence Interval: check if you want the confidence interval displayed; default is not to display the confidence interval.
- Type of Test, Alpha: the input form below is displayed if this option is selected.
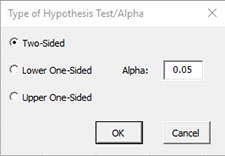
- Select the Type of Test: two-sided; lower one-sided, or upper one-sided, the default is two-sided.
- Alpha: this is the confidence level; 1-alpha is the confidence interval, default is 0.05 or 95% confidence interval.
- Output Options: the input form below is displayed if this option is selected.
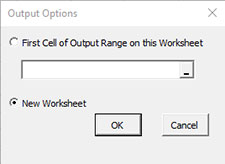
- First Cell of Output Range on this Worksheet: Select this option if you want the output on an existing worksheet; then select the first cell of the range where you want the output placed; a check is made to ensure that no existing data are overwritten in the worksheet.
- New Worksheet: Select this option if you want the results on a new worksheet.
- Select OK to generate the results.
- Select Cancel to end the program.
One Sample Sign Test Output
The output from the One Sample Sign Test is shown below.

The null hypothesis (m is median) and the alternate hypothesis (two sided in this example) are listed at the top.
- Median: Calculated median from the data.
- Alpha: Value of alpha entered by user.
- Specified Median: Specified median entered by user.
- Number Below m0: Number of values below the median.
- Number = m0: Number of values equal to the median.
- Number Above m0: Number of values above the median.
- Sample Size (Less = m0): Sample size not including values equal to specified median.
- p value: Calculated p value (will be red if ≤alpha).
The conclusions, based on value of p and alpha, are given. Reject the null hypothesis if p value < alpha.
Notes:
- Any values equal to the median are not included; this reduces the effective sample size but should not be an issue as long as there are not too many values equal to the median.
- The software uses the binomial distribution for the calculations and does not use a normal approximation as the sample size becomes large.
- Exact confidence intervals cannot usually be calculated because of the discreteness of the binomial distribution. Usually two confidence intervals will be given: the one above (1-alpha) % and one below it.