One Proportion Test Help
Home » SPC for Excel Help » Statistical Tools » Sample Tests Help » One Proportion Test Help
This test is performed with binary data when you want to examine the absence or presence of a specific attribute. This type of test is very common in elections when polling people to find out if they support person A or person B.
The test gives two options based on the size of the sample: large or small sample. A different approach is used based on which case is selected. You should select the large sample case when npbar > 10 where n = sample size and pbar is the average proportion of events.

You have the option for a hypothesis test based on a hypothesized proportion. You also have the option for a two-sided, lower one-sided or an upper one-sided test.
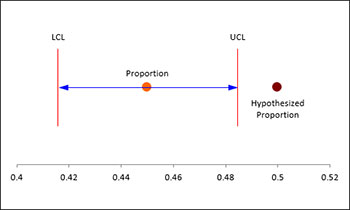
The One Sample Proportion Test input form is shown above. The data are entered directly into the input form. For example, consider the following example. A magazine conducted a telephone survey of 800 adults and asked if they had guns in the home. 45% of the respondents said yes. We want to develop a 95% confidence interval for the proportion of homes with guns. We also want a hypothesis test to see if 50% of the homes have guns. In this example, n = 800 and pbar = .45. Thus, n(pbar) =800(.45) = 360. We will use the large sample option.
- 1. Select “Sample Tests” from the “Statistical Tools” panel in the SPC for Excel ribbon.
- 2. Select the “One Proportion Test” option from the “Sample Tests” form. Select OK and the input form below is shown.
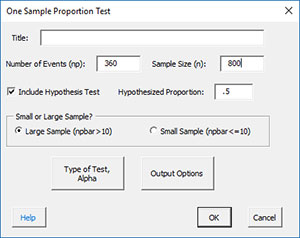
- Title: enter the title of the test (optional).
- Number of Events: this is the number of events that occurred; in this example, the number of respondents who said they had guns in their house.
- Sample Size: this is the sample size; the total number of people survey in this example.
- Small or Large Sample: select the large sample size if npbar is greater than 10; select the small sample size if it is less than 10.
- Type of Test, Alpha: the input form below is displayed if this option is selected.
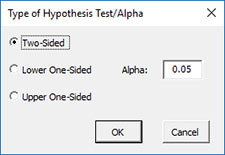
- Select the Type of Test: two-sided; lower one-sided, or upper one-sided, the default is two-sided.
- Alpha: this is the confidence level; 1-alpha is the confidence interval, default is 0.05 or 95% confidence interval.
- Output Options: the input form below is displayed if this option is selected.
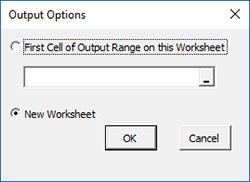
- First Cell of Output Range on this Worksheet: Select this option if you want the output on an existing worksheet; then select the first cell of the range where you want the output placed; a check is made to ensure that no existing data are overwritten in the worksheet.
- New Worksheet: Select this option if you want the results on a new worksheet.
- Enter Average, Sigma and Size: the input form below is displayed if this option is selected.
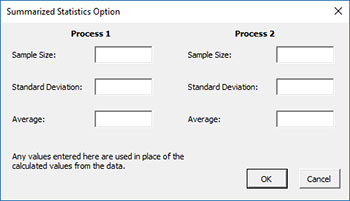
- You many enter the sample size, standard deviation, or the average for processes 1 and 2; any value that is entered will be used in place of the values calculated from the data.
- Select OK to generate the results.
- Select Cancel to end the program.
One Proportion Test Output
The output from the One Sample Proportion Test is shown below. The entries are explained below the output.
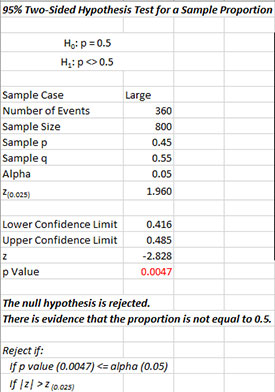
The output tells you the conclusion from the test. The null hypothesis (H0) and the alternate hypothesis (H1) are printed below the title.
- Sample Case: Sample case selected by user
- Number of Events: Number of events entered by user
- Sample Size: Sample size entered by user
- Sample p: Sample p = events/sample size
- Sample q: Sample q = 1 – p
- Alpha: Alpha entered by user
- z(0.025): Calculated z value based on alpha
- Lower Confidence Limit: 100(1-alpha)% upper confidence interval
- Upper Confidence Limit: 100(1-alpha)% lower confidence interval
- z: Calculated z value
- p Value: Calculated p value (in red if p value ? alpha)
A plot of the confidence interval is also given which shows the relationship of the confidence interval to the hypothesized proportion.