Sample Size and Margin of Error Estimation Help
Home » SPC for Excel Help » Statistical Tools » Sample Tests Help » Sample Size and Margin of Error Estimation Help
You often sample processes to determine process parameters such as the average or standard deviation. But the sample result is not the true value most likely. There is going to be variation in the results. How does sample size impact the margin of error? Or vice versa.
SPC for Excel includes a tool to estimate the sample size needed for given margins of error or the margin of error for given samples size(s).
This page contains the following for the sample size/margin of error technique:

Data Entry
Data is entered into an input form. The steps in doing that are given below.
- Select “Sample Tests” from the “Statistical Tools” panel in the SPC for Excel ribbon.
- Select the “Sample Size/Power”.
- Select “Sample Size/Margin of Error”.
- Select OK and the input form below is shown.
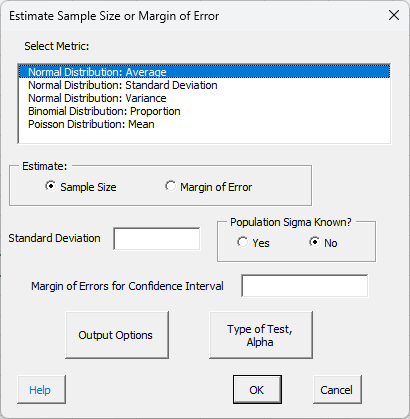
- Select Metric: select the metric for which you are estimating the sample size or margin of error; the options are shown in the input form above.
- Estimate: select either the sample size or margin of error to be estimated: sample size is the default.
- Standard Deviation: enter the standard deviation.
- Population Sigma Known? : select No (the default) is the standard deviation is estimated from a sample or Yes if the population sigma is known.
- Margin of Errors for Confidence Interval: enter the margin of errors you want to estimate the sample size for, e.g’, 10 50 20. Leave a space between the margin of errors if you want to estimate the sample size for more than one margin of error. (Note: if you select Maring of Error to estimate above, you will enter the sample sizes that you want you to estimate the margin of error for.
- Output Options: the input form below is displayed if this option is selected.
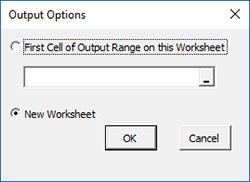
- First Cell of Output Range on this Worksheet: Select this option if you want the output on an existing worksheet; then select the first cell of the range where you want the output placed; a check is made to ensure that no existing data are overwritten in the worksheet.
- New Worksheet: Select this option if you want the results on a new worksheet.
- Type of Test, Alpha: the input form below is displayed if this option is selected.
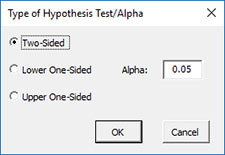
- Select the Type of Test: two-sided; lower one-sided, or upper one-sided, the default is two-sided.
- Alpha: this is the confidence level; 1-alpha is the confidence interval, default is 0.05 or 95% confidence interval.
- Select OK and the analysis is performed and results generated.
Output
Suppose you have entered the following information in the input form above:
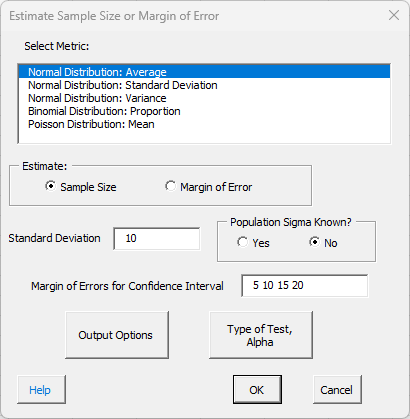
Select OK and the output below is generated
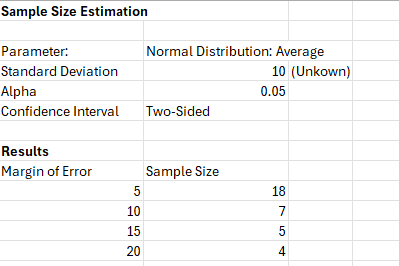
The top part of the output displays the population parameter being estimated, as well the value of the standard deviation, alpha and type of test, e.g. two-sided. All this is input from the users.
Below that are the results. Each margin of error is listed and the calculated sample size is given.