t Test for Paired Samples Help
Home » SPC for Excel Help » Statistical Tools » Sample Tests Help » t Test for Paired Samples Help
The paired sample comparison t test is used when the samples are not independent. For example, you might want to compare two analytical test methods. You take a series of samples; mix them well; divide them in half; and run one-half in one analytical test method and the other half in the second analytical test. The samples are not independent in this case. You can use this test to determine if there is a significant difference in the two tests. You have the option for a two-sided, lower one-sided or an upper one-sided test.

The data can be in a range in a worksheet or the user can enter an average, standard deviation, and sample size for the differences in paired samples. The example below demonstrates how to perform the paired samples comparison.
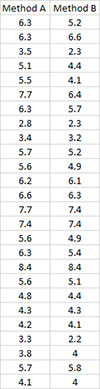
A medical researcher wants to compare two methods of measuring cardiac output. Method A is the standard method and is considered very accurate. But this method is invasive. Method B is less accurate but not invasive. Cardiac output from 26 patients was measured using both methods. We want to sue the paired sample t test to determine if there is a significant difference between the two methods.
- 1. Enter the data for the two methods into a worksheet as shown below. The data does not have to be in adjacent columns. The data can be downloaded at this link.
- 2. Select the data shown above including the headings.
- 3. Select “Sample Tests” from the “Statistical Tools” panel in the SPC for Excel ribbon.
- 4. Select the “t Test for Paired Samples Comparison” option from the “Sample Tests” form. Select OK and the input form below is displayed.
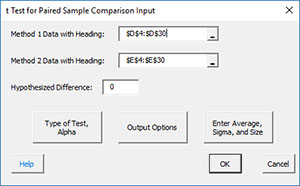
- Method 1 Data with Headings: enter the range containing method 1 data along with the headings ; default is the range selected on the worksheet.
- Method 2 Data with Headings: enter the range containing method 2 data along with the headings ; default is the column next to method 1 data.
- Hypothesized Difference: enter the hypothesized difference; default is 0.
- Type of Test, Alpha: the input form below is displayed if this option is selected
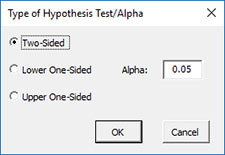
- Select the Type of Test: two-sided; lower one-sided, or upper one-sided, the default is two-sided.
- Alpha: this is the confidence level; 1-alpha is the confidence interval, default is 0.05 or 95% confidence interval.
- Output Options: the input form below is displayed if this option is selected.
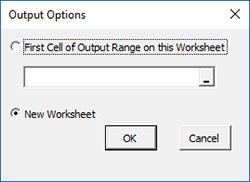
- First Cell of Output Range on this Worksheet: Select this option if you want the output on an existing worksheet; then select the first cell of the range where you want the output placed; a check is made to ensure that no existing data are overwritten in the worksheet.
- New Worksheet: Select this option if you want the results on a new worksheet.
- Enter Average, Sigma and Size: the input form below is displayed if this option is selected.
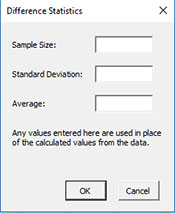
- You many enter the sample size, standard deviation, or the average based on the difference between paired samples; any value that is entered will be used in place of the values calculated from the data.
- Select OK to generate the results.
- Select Cancel to end the program.
t Test for Paired Samples Comparison Output
The output from the example data (using a hypothesized difference = 0) is shown below. An explanation of terms is given below the output.
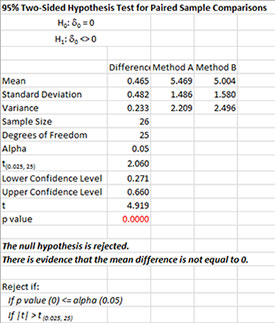
The output tells you the conclusion from the test. The null hypothesis (H0) and the alternate hypothesis (H1) are printed below the title.
- Mean: Calculated means, difference is Method A – Method B
- Standard Deviation: Calculated standard deviations
- Variance: Calculated variances
- Sample Size: Number of paired samples
- Degrees of Freedom: Paired Samples – 1
- Alpha: Alpha entered by user
- t(0.025, 25): t value based on alpha and degrees of freedom
- Upper Confidence Level: 100(1-alpha)% upper confidence limit
- Lower Confidence Level: 100(1-alpha)% lower confidence limit
- t: Calculated t value
- p value: Calculated p value (in red if p value ≤ alpha)
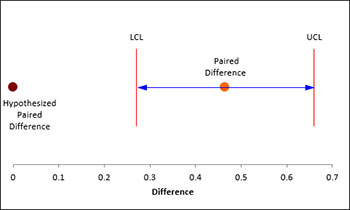
A plot of the confidence interval is also given:
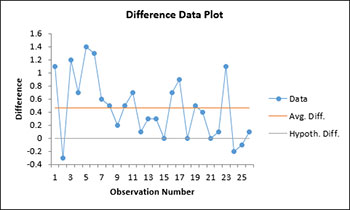
There is also a chart of the difference data to look for possible outliers. If the program detects possible outliers, they will be in red and a message will be printed on the worksheet.