z and t Tests for Difference in Two Means Help
Home » SPC for Excel Help » Statistical Tools » Sample Tests Help » z and t Tests for Difference in Two Means Help
This test compares the means of two samples. The test will provide a confidence interval for the difference in two means and has the option for hypothesis testing as well. The test accounts automatically for variances that are equal or unequal.

You have the following two options:
- t test: This test uses the t distribution and is usually used with smaller sample sizes although it can be used with any sample size.
- z test: This test uses the z distribution and is usually used with larger sample sizes (> 30).
You also have the option for a two-sided, lower one-sided or an upper one-sided test.
The data can be in a range in a worksheet or the user can enter an average, standard deviation, and sample size for the two processes. The example below demonstrates how to do this test using data in a range in the worksheet.
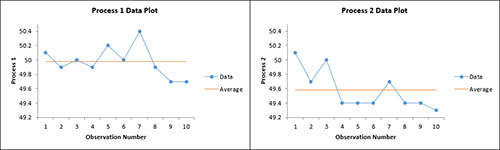
A company uses two different processes to put sand into bags. The question is whether each process places the same weight into the bags. Ten bags from each process were weighed. The data are shown below. We want to see if there is a difference in the means from the two processes.
- 1. Enter the data into a worksheet as shown below. The data must be in columns. The data can be downloaded at this link.
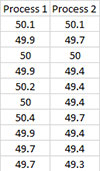
- 2. Select the data shown above including the headings.
- 3. Select “Sample Tests” from the “Statistical Tools” panel in the SPC for Excel ribbon.
- 4. Select the “z and t Tests for Difference in Two Means” option from the “Sample Tests” form. Select OK and the input form below is displayed.
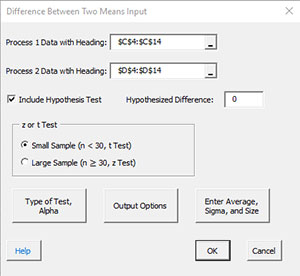
- Process 1 Data with Headings: enter the range containing process 1 data along with the headings ; default is the range selected on the worksheet.
- Process 2 Data with Headings: enter the range containing process 2 data along with the headings ; default is the column next to process 1 data.
- Include Hypothesis Test: this option will include a hypothesis test in addition to the confidence interval. If you select this option, you must include a hypothesized difference.
- Small or Large Sample Case: this determines the case to use for the calculations; the default is based on the sample size.
- If the size is less than 30, the small sample case is selected. This will apply the t test.
- If the size is greater than or equal to 30 the large sample cause is selected.
- You may override this selection by selecting which case you want to use.
- Type of Test, Alpha: the input form below is displayed if this option is selected.
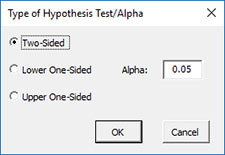
- Select the Type of Test: two-sided; lower one-sided, or upper one-sided, the default is two-sided.
- Alpha: this is the confidence level; 1-alpha is the confidence interval, default is 0.05 or 95% confidence interval.
- Output Options: the input form below is displayed if this option is selected.
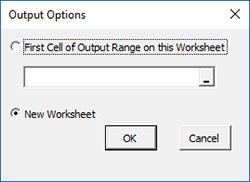
- First Cell of Output Range on this Worksheet: Select this option if you want the output on an existing worksheet; then select the first cell of the range where you want the output placed; a check is made to ensure that no existing data are overwritten in the worksheet.
- New Worksheet: Select this option if you want the results on a new worksheet.
- Enter Average, Sigma and Size: the input form below is displayed if this option is selected.
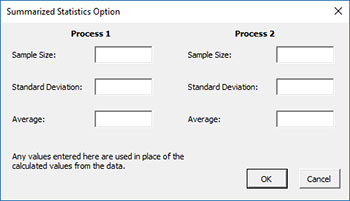
- You many enter the sample size, standard deviation, or the average for processes 1 and 2; any value that is entered will be used in place of the values calculated from the data.
- Select OK to generate the results.
- Select Cancel to end the program.
Difference in Two Means Output
The output from the example data (using the t test) is shown below. The hypothesized difference in means 0 in this example. An explanation of terms is given below the output.
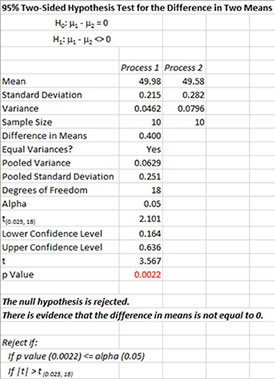
The output tells you the conclusion from the test. The null hypothesis (H0) and the alternate hypothesis (H1) are printed below the title.
- Mean: Calculated means of two processes
- Standard Deviation: Calculated standard deviation of two processes
- Variance: Calculated variance of two processes
- Sample Size: Sample size for each process
- Difference in Means: Process 1 Mean – Process 2 Mean
- Equal Variances?: Yes is variances are equal; no if not
- Pooled Variance: Pooled variance based on equal or unequal variances
- Pooled Standard Deviation: Pooled standard deviation based on equal or unequal variances
- Degrees of Freedom: Degrees of freedom (depends on equal or unequal variance)
- Alpha: Alpha entered by user
- t(0.025, 18): t value based on alpha and degrees of freedom
- Lower Confidence Level: 100(1-alpha)% lower confidence interval
- Upper Confidence Level: 100(1-alpha)% upper confidence interval
- t: Calculated t value
- p Value: Calculated p value (in red if p value < alpha)
Notes:
- The difference in means is the mean of Process 1 – mean of Process 2.
- The test uses the F test to determine if the variances are equal or not equal. This changes the way the pooled variance and degrees of freedom are calculated.
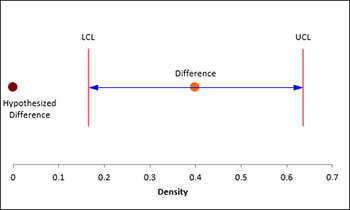
A plot of the confidence interval is also given. This makes it easy to see the relationship between the hypothesized difference and the confidence interval.
There are also charts for both process data to look for possible outliers. If the program detects possible outliers, they will be in red and a message will be printed on the worksheet.