Two Proportion Test Help
Home » SPC for Excel Help » Statistical Tools » Sample Tests Help » Two Proportion Test Help
This test is used to compare the proportions or rates of two populations with binary outcomes. For example, you could be testing two different drugs to determine if one is better than another at curing a certain illness. The Two Proportions Test can be used to determine this.

You have the option to pool the p estimate if the hypothesized proportion = 0. You also have the option for a two-sided, lower one-sided or an upper one-sided test. An example of using the Two Proportions Test is given below.
A test was performed to compare two drug therapies on leukemia. The results are shown below. We want to use these results to conduct a two proportion test.
- 1. Select “Sample Tests” from the “Statistical Tools” panel in the SPC for Excel ribbon.
- 2. Select the “Two Proportion Test” option from the “Sample Tests” form. Select OK and the input form below is shown.
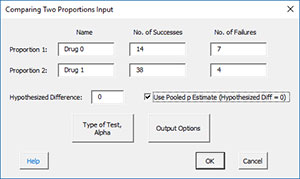
- Prop 1: Enter the name, number of successes and number of failures for the first proportion.
- Prop 2: Enter the name, number of successes and number of failures for the second proportion.
- Hypothesized Difference: this is the difference in proportions you specify. If the hypothesized difference is 0, you can use the pooled p estimate.
- Type of Test, Alpha: the input form below is displayed if this option is selected.
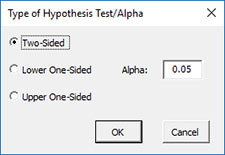
- Select the Type of Test: two-sided; lower one-sided, or upper one-sided, the default is two-sided.
- Alpha: this is the confidence level; 1-alpha is the confidence interval, default is 0.05 or 95% confidence interval.
- Output Options: the input form below is displayed if this option is selected.
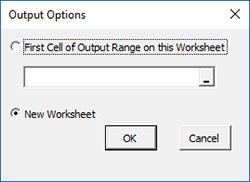
- First Cell of Output Range on this Worksheet: Select this option if you want the output on an existing worksheet; then select the first cell of the range where you want the output placed; a check is made to ensure that no existing data are overwritten in the worksheet.
- New Worksheet: Select this option if you want the results on a new worksheet.
- Select OK to generate the results.
- Select Cancel to end the program.
Two Sample Proportions Output
The output for the example data for the Two Proportions Test is given below. The terms are explained below the output.
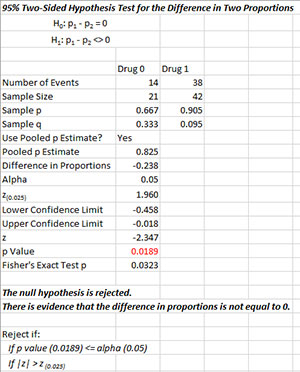
The output tells you the conclusion from the test. The null hypothesis (H0) and the alternate hypothesis (H1) are printed below the title.
- Number of Events: Number of events from data
- Sample Size: Calculated sample size from data
- Sample p: Calculated sample proportion of events
- Sample q: Calculated sample proportion of non-events
- Use Pooled p Estimate?: Yes, if pooled estimate is used
- Pooled p Estimate: Calculated pooled estimate of proportion of events
- Difference in Proportions: Calculated difference in proportion of events
- Alpha: Alpha entered by user
- z(0.025): z value based on alpha
- Lower Confidence Limit: 100(1-alpha)% lower confidence limit
- Upper Confidence Limit: 100(1-alpha)% upper confidence limit
- z: Calculated z value
- p Value: Calculated p value (in red if p value < alpha)
- Fisher’s Exact Test p: Will be included if hypothesized difference is 0
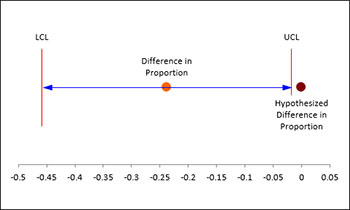
There is also a plot of the confidence interval provided: