Updating/Options
Home » SPC for Excel Help » Updating/Options
Many of the charts in SPC for Excel can be updated with the new data or have the options changed after the chart has been made for the first time. These charts include:
- Pareto charts
- Histograms
- Control Charts
- Process Capability Charts
- Scatter Diagrams
- Waterfall Charts
Select the “Updating/Options” panel on the SPC for Excel ribbon to update a chart with new data or to change the options used to make the chart.

Update Charts
To update a chart, add new data to the spreadsheet containing the original data. The program will find the new data and add it to the chart. To see how the program finds the new data, please refer to the chart’s help page.
To begin to update a chart, select the “Update Charts” on the Updating/Options panel on the SPC for Excel Ribbon.
An input screen containing all the charts available for update in the workbook will be displayed. An example of this input screen is shown below.
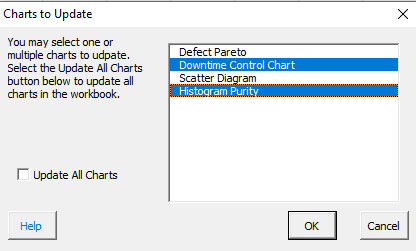
Select the charts you want to update. You can select one chart, multiple charts or all charts. Then select OK for the selected charts to update with the new data.
Options
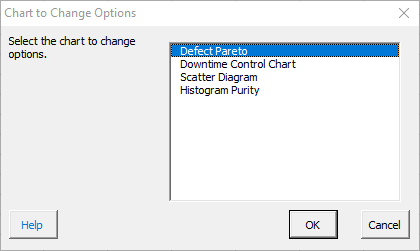
To change the options for a chart, select “Options” on the Updating/Options panel on the SPC for Excel Ribbon.
An input screen containing all the charts available in the workbook will be displayed. An example of this input screen is shown below.
Select the chart whose options you want to change. You can only change the options for one chart at a time. Select OK and the input screen for that chart will be displayed. Please see the help for each type of chart for their input screens.
This option only changes the options for the chart. The chart is remade with the new options, but no new data are added. If you added new data and then changed the options, you will need to update the chart to add the new data.