Interpretation of Control Charts Complete Teaching Guide
$79.00
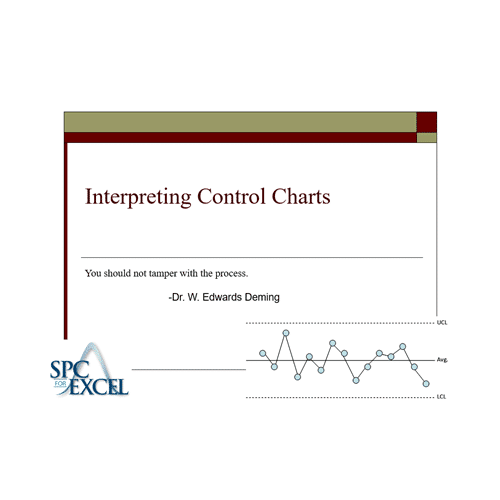
A control chart represents a picture of a process over time. To effectively use control charts, one must be able to interpret the picture. What is this control chart telling me about my process? Is this picture telling me that everything is all right and I can relax? Is this picture telling me that something is wrong and I should get up and find out what has happened? This module presents various methods of interpreting a control chart.
The purpose of this module is to introduce the general model used for control charts, how control charts relate to a process, how to recognize a process in statistical control and the various tests for out of control situations. These out of control tests include points beyond the limits, the zones tests, tests for stratification and mixtures, and the rule of seven tests.
This module includes:
- Handout (17 pages)
- Teaching Guide (2 pages)
- Solutions to Exercises (4 pages)
- PowerPoint Presentation (28)
- Excel Workbook Containing the Example Data
