Process Capability Options in SPC for Excel
Home » Process Capability Options in SPC for Excel
Easily see if your process is meeting customer specifications with SPC for Excel’s process capability techniques for normally and non-normally distributed data:

Normal Process Capability Snapshot
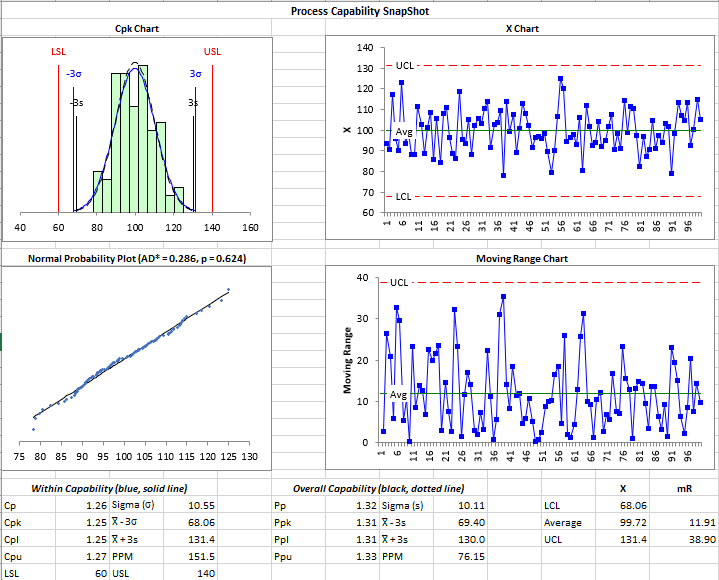
- Consists of Cpk chart, control chart (either X-R, X-s or X-mR), normal probability plot and select statistics
- Cpk chart: contains many of the options listed below
- Select Out of Control Tests for control chart
- Includes Anderson-Darling statistic and p value for normal probability plot
- Select statistics included at bottom of page
Non-normal Process Capability Snapshot
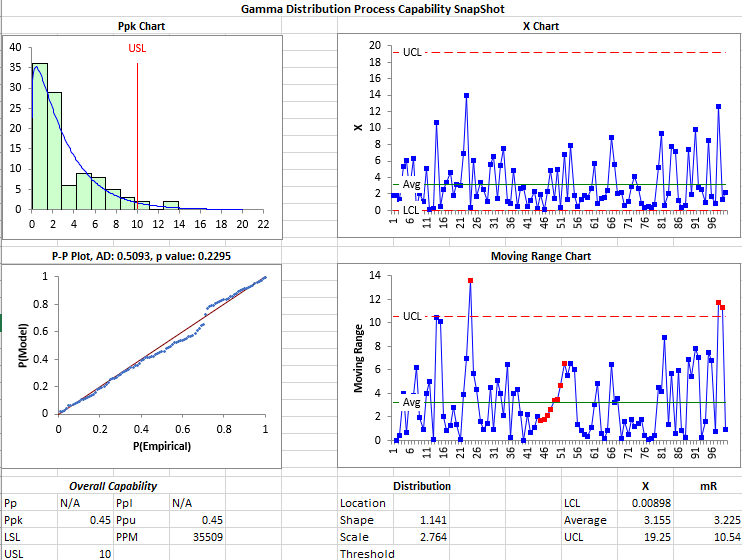
- Consists of Ppk chart, control chart (either X-R, X-s or X-mR), P-P plot to test the fit of the distribution and statistics
- Ppk chart: contains many of the options listed below
- Select out of control tests for control chart
- Includes Anderson-Darling statistic and p value for the P-P plot
- Select statistics included at bottom of page
Normal Process Capability (Cpk/Ppk)
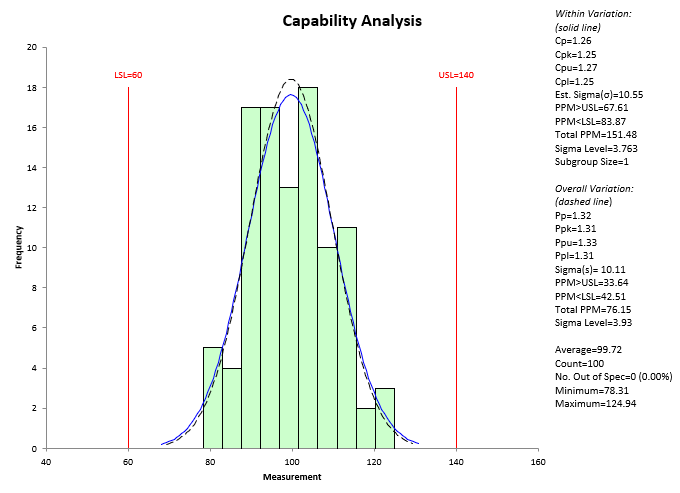
- Histogram
- Lower specification limit, nominal (if entered), upper specification limit (only one specification is required as the software handles one-sided specifications)
- Normal curve based on estimated sigma and/or calculated standard deviation
- +/- 3 sigma limits based on estimated sigma and/or calculated standard deviation
- Plot average
- Shade/unshade histogram option
- Confidence limits for Cpk and Ppk
- For subgroups, base estimate of sigma on average range, average standard deviation or pooled variance
- Output Statistics Options:
- Within Process Capability (based on estimated sigma)
- Overall Process Capability (based on calculated standard deviation)
- General Statistics
- Add target (to calculate Cpm)
- Option to remove outliers
- Option to use historical average and standard deviation in the calculations
- Option to transform the data with Box-Cox or Johnson transformations
- Add dates of data collection
- Change the number of classes, the class width or the starting point on the histogram
- Easily update with new data
- Process capability table to summarize all process capability charts in a workbook
Non-Normal Process Capability (Ppk)
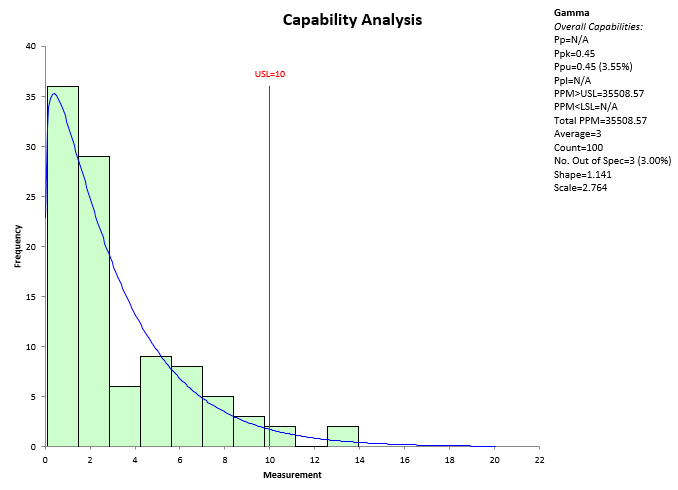
- Histogram
- Lower specification limit, nominal (if entered), upper specification limit (only one specification is required as the software handles one-sided specifications)
- Select one of 13 distributions for the analysis:
- Exponential
- Exponential - Two Parameter
- Gamma
- Gamma - Three Parameter
- Largest Extreme Value
- Logistic
- LogLogistic
- LogLogistic - Three Parameter
- LogNormal
- LogNormal - Three Parameter
- Normal
- Smallest Extreme Value
- Weibull
- Weibull - Three Parameter
- Option to enter the parameters for the distribution or have SPC for Excel find the best-fit parameters
- Option to plot average
- Option to shade the histogram
- Add dates of data collection
- Add titles and axis labels
- Add target to calculate Cpm
- Change the number of classes, the class width or the starting point on the histogram
- Easily update with new data
- Process capability table to summarize all process capability charts in a workbook
Binomial Capability
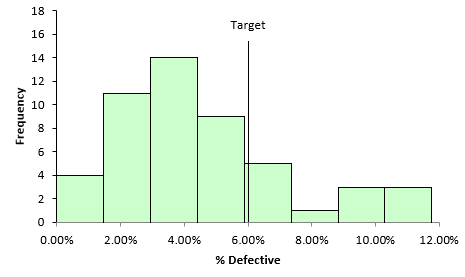
- Histogram
- Optional Target
- p Control Chart
- Select Out of Control Tests
- % Defective vs. Subgroup Size Chart
- PPM Defective
- Change the number of classes, the class width or the starting point on the histogram
Poisson Capability
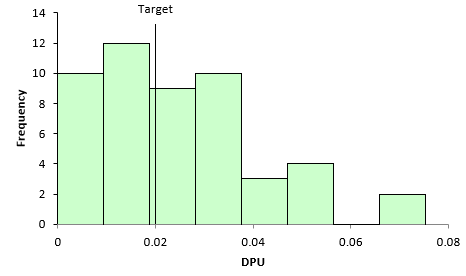
- Histogram
- Optional Target
- u Control Chart
- Select Out of Control Tests
- Cumulative DPU Chart
- DPU versus Subgroup Size Chart
- Change the number of classes, the class width or the starting point on the histogram