Experimental Design
Home » SPC for Excel Software » Experimental Design
Experimental design techniques are designed to discover what factors or interactions have a significant impact on a response variable. Our SPC for Excel provides an easy-to-use design of experiments (DOE) methodology in the Excel environment you know. The SPC for Excel software contains the following DOE routines:
- Two-Level Full Factorial Designs (up to 7 factors)
- Fractional Factorial Designs (29 different designs, two-level, up to 15 factors
- Plackett-Burman Designs (up to 27 factors)
Watch a Video Highlighting SPC for Excel's Experimental Design Capabilities!
Join those in over 80 countries using SPC for Excel!
Experimental Design Features
- Full factorials
- Fractional factorials
- Plackett- Burman
- Design table analysis
- ANOVA Table for factors and interactions
- ANOVA for model
- Model for coded and actual factors
- Design statistics
- Average
- Standard deviation
- Coefficient of variation
- R square
- Adjusted R square
- PRESS
- R square prediction
- Normal plot of effects
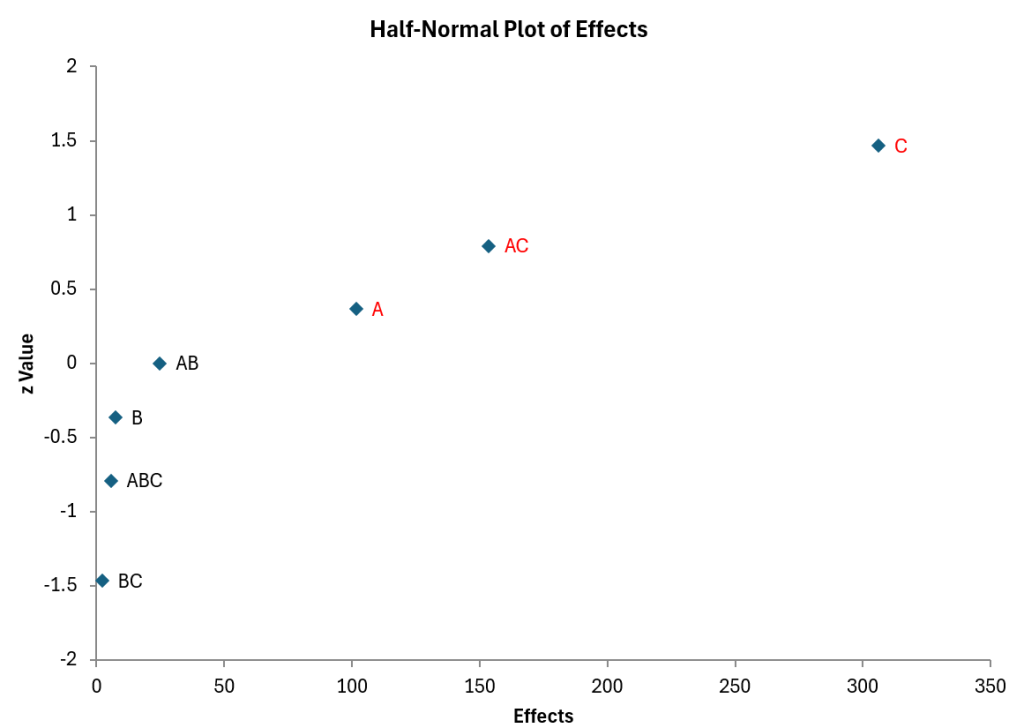
- Half-normal plot of effects
- Effects charts
- Two factor charts
- Residuals analysis
- Residuals
- Leverage
- Standardized residuals
- Internally studentized residuals
- Externally studentized residuals
- DFFITS
- Cook's distance
- Potential outliers in red
- Residuals charts (raw, standardized, internally or externally studentized residuals)
- Normal plot
- Versus predicted values
- Versus actual run number
- Other charts
- Predicted vs actual
- DFFITS, Cook's distance and leverage versus actual run number
- DOE optimization chart
- Easily select effects to include/exclude in the analysis
- p values < 0.05 in red