Histograms
Home » SPC for Excel Software » Histograms
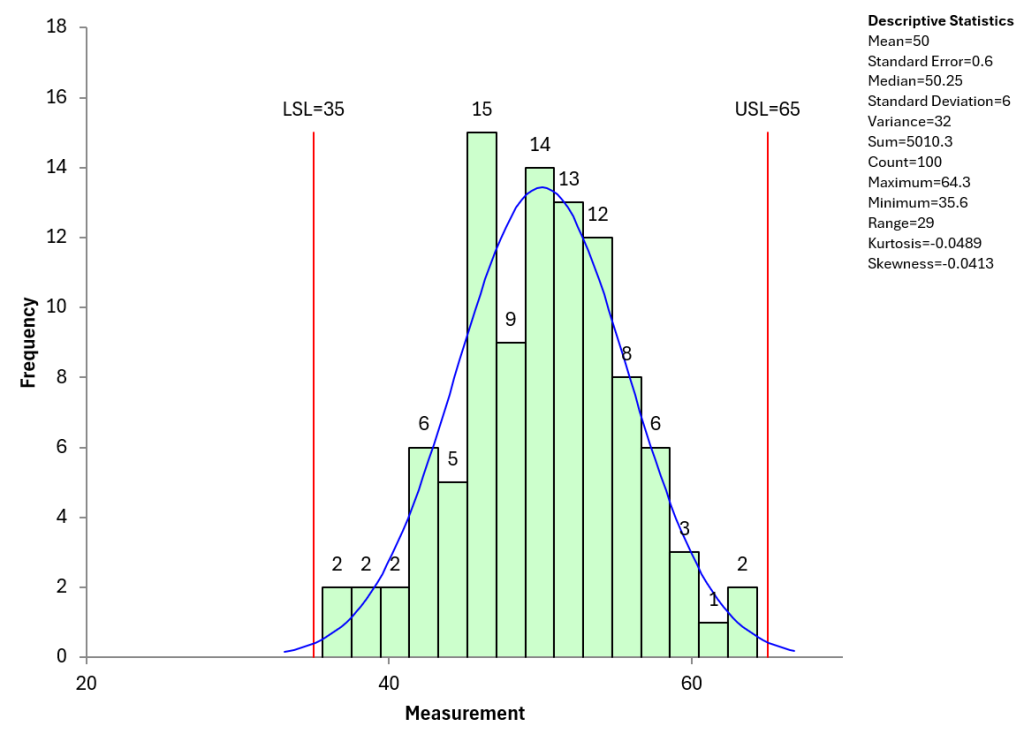
Our SPC software, SPC for Excel, easily constructs and updates histograms. A histogram is a bar chart that provides a snapshot in time of the variation in a process. It tells us how often a value or range of values occurred in a given time frame. A histogram will tell us the most frequently occurring value (the mode), the overall range, and the shape of the distribution (e.g., bell-shaped, skewed, bimodal, etc.). Three types of histograms are:
- Basic histogram
- Create multiple histograms at once
- Group histogram to compare more than one process on same histogram
Watch a Video Highlighting How to Construct a Histogram with SPC for Excel
Join those in over 80 countries using SPC for Excel to create their histograms!
Histogram Key Features
- Easily update with new data
- Add specifications and nominal
- Add normal distribution or 1 of 13 non-normal distributions
- Add descriptive statistics
- Select which descriptive statistics to include
- Change number of classes/class width on existing histogram