Process Capability Analysis in Excel (Cpk & Ppk)
Home » SPC for Excel Software » Process Capability Analysis in Excel (Cpk & Ppk)
Automatically calculate Cpk, Ppk, Cp, and Pp and generate process capability charts directly inside Excel
- Automatic Cpk and Ppk calculations
- Normal and non-normal process capability
- Built-in histograms and probability plots
- Capability snapshot reports
- Binomial and Poisson capability
Full featured trial. No credit card required.
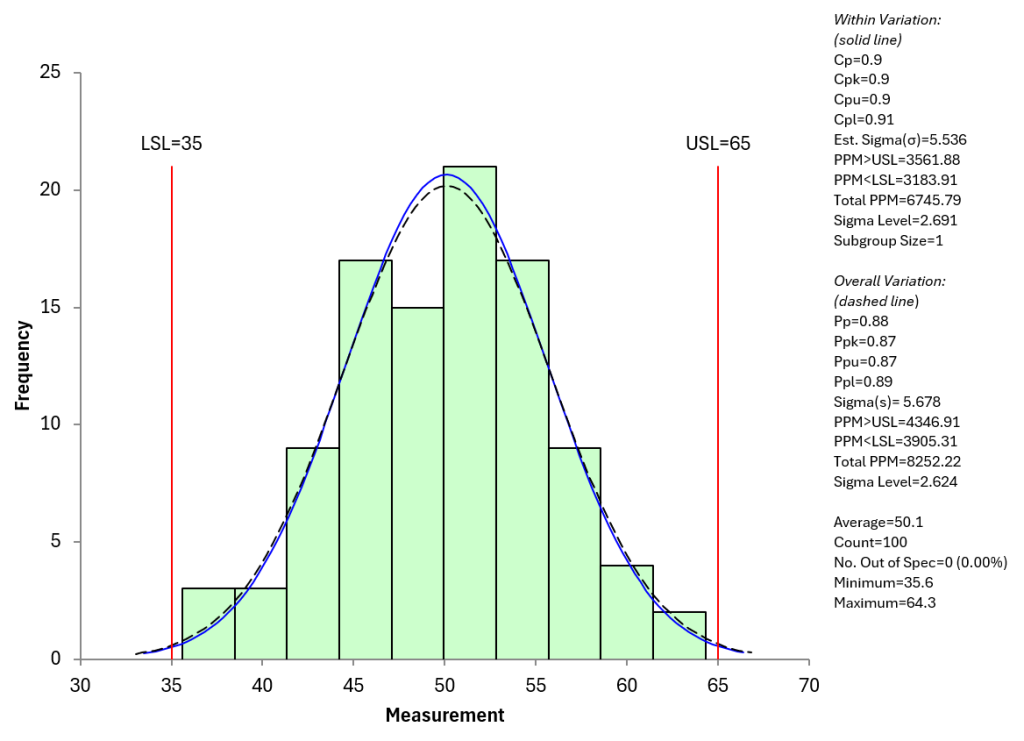
Example: Process capability analysis generated automatically in SPC for Excel.
What is process capability analysis?
Process capability analysis measures how well a process performs relative to specification limits. Indices such as Cpk and Ppk quantify whether a process is capable of meeting customer requirements.
How to calculate Cp and Cpk in Excel
Cp = (USL-LSL)/6σ
Cpk = Minimum (Cpu, Cpl)
Cpu=(USL-Average)/3σ
Cpl=(Average-LSL)/3σ
How to Calculate Pp and Ppk in Excel
Pp = (USL-LSL)/6s
Ppk = Minimum (Cpu, Cpl)
Ppu=(USL-Average)/3s
Ppl=(Average-LSL)/3s
where s = the process standard deviation estimated from a range control chart; s = the calculated standard deviation using all the data, LSL = lower specification limit, USL = upper specification limit and Average = overall process average
While Excel formulas can be used to calculate these values manually, there is always the risk of the formula being entered wrong in Excel or a number being entered wrong plus the process capability chart still has to be made. SPC for Excel automates the entire process.
Types of process capability included
Normal Process Capability
Evaluate process performance against specifications assuming a normal distribution. SPC for Excel calculates Cp, Cpk, Pp, and Ppk and displays results alongside histograms, specification limits, normal distribution and summary statistics.
Non-Normal Process Capability
Not all processes follow a normal distribution. SPC for Excel includes methods for analyzing non-normal data, helping ensure capability indices are meaningful and statistically appropriate.
Multiple Process Capability Analysis
Compare multiple processes or data sets within a single analysis to evaluate overall performance across lines, machines, or shifts.
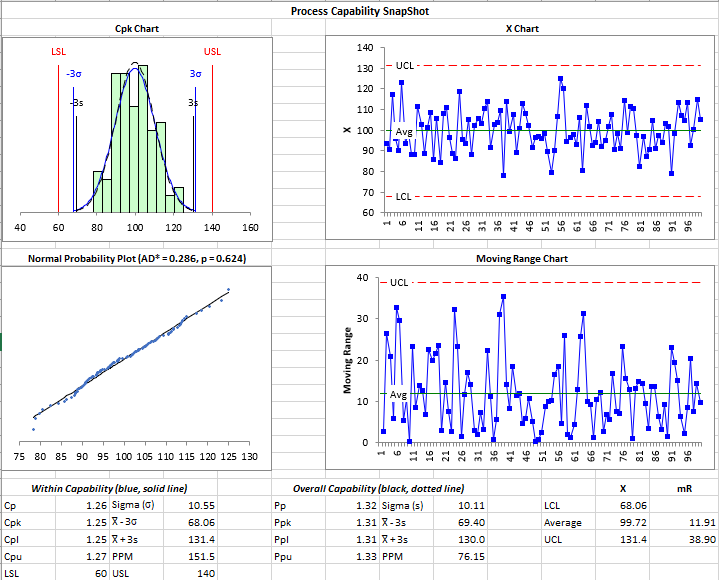
Process Capability SnapShot
Generate a consolidated view for normal and non-normal process capability analysis that includes histograms, probability plots, control charts, and summary capability indices in one integrated output.
Binomial and Poisson Capability
Analyze attribute data and count-based processes using binomial and Poisson capability methods directly within Excel.
What a complete process capability snapshot includes
The snapshot of process capability checks to see if the process is in statistical control by showing a control chart, checks to see if it meet the normal or non-normal distribution with a probability plot and provides all the statistics used in the calculations.
Frequently Asked Questions
What is the difference between Cpk and Ppk?
Cpk reflects potential capability using short-term (s = within-subgroup estimated from a range control chart) variation, while Ppk reflects actual performance using long-term (s = overall calculated using all the data ) variation. Both indices help evaluate how well a process meets specifications.
Can Excel calculate Cpk and Ppk?
Yes, Excel can calculate Cpk and Ppk using formulas. However, manual calculations require careful setup and validation. SPC for Excel automates these calculations and generates supporting charts.
What is a good Cpk value?
Cpk values represent how capable a process is at meeting specification limits. The larger the Cpk value, the more capable it is of meeting specifications. The following are generally accepted:
-
Cpk ≥ 1.33: generally considered good / capable for most industries
-
Cpk ≥ 1.67: very good, often used for critical processes
-
Cpk ≥ 2.0: excellent / world-class capability
-
Cpk < 1.0: process is not capable (too much variation or off-center)
Does SPC for Excel handle non-normal data?
Yes. SPC for Excel includes methods for analyzing non-normal data, ensuring capability indices are statistically valid when normal assumptions don’t apply.