Regression
Home » SPC for Excel Software » Regression
Regression is used to discover what predictor variables (X) significantly impact the response variable (Y). The objective is to build a model that predicts the value of the response variable.
SPC for Excel handles categorical predictors as well as numeric predictors. The regression routines available in SPC for Excel are:
- Multiple Linear Regression
- Stepwise Regression
- Forward Selection
- Backward Elimination
- Best Subsets
- Poisson Regression
- Binary Logistic Regression
Watch a Video Featuring SPC for Excel's Regression Analysis
Join those in over 80 countries using SPC for Excel!
Regression and SPC for Excel
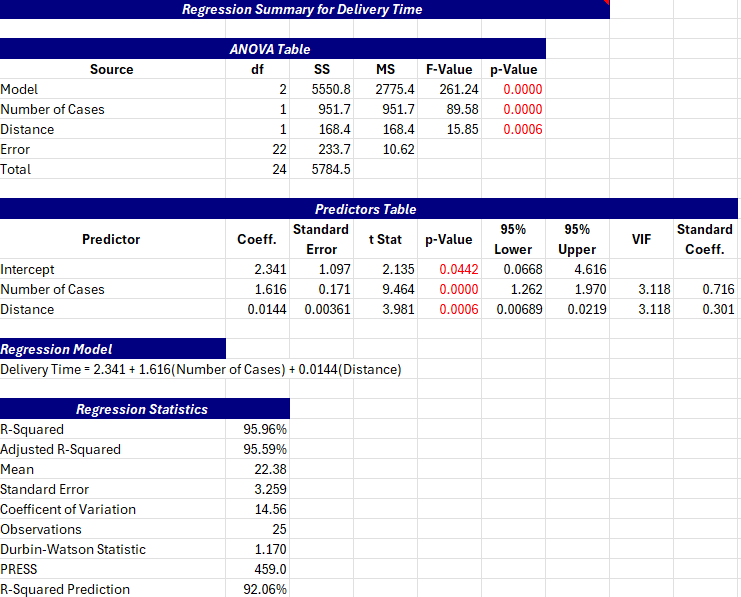
The regression techniques in SPC for Excel include detailed output for analysis. The output includes:
- Regression model
- ANOVA table
- Predictors’ Table
- Regression statistics
- Multiple residuals
- Ability to predict results
- Normal probability plot of standardize residuals
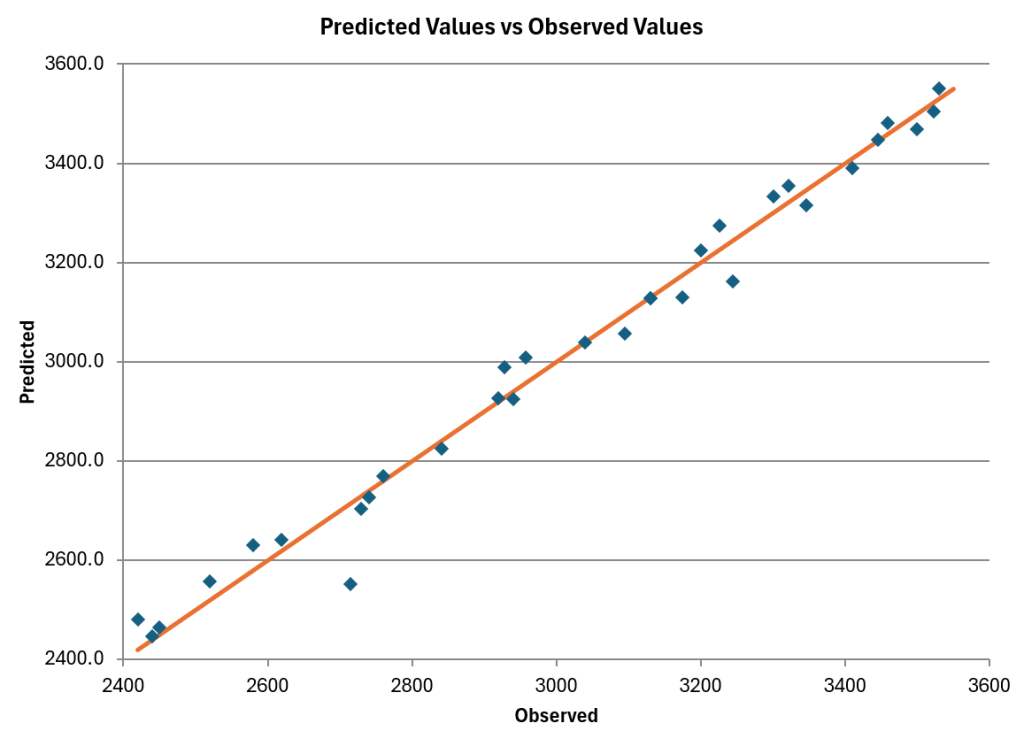
- Predicted versus actual results
There also is the option to generate more residual results, e.g., residuals versus observation number.
You can also rerun the regression after removing observations, removing variables or transforming the Y values.