Time Series Analysis
Home » SPC for Excel Software » Time Series Analysis
Do you need to model a process that has a trend or seasonal variation? SPC for Excel contains the following basic time series analysis:
- Linear
- Quadratic
- Exponential Growth
- Single Exponential Growth
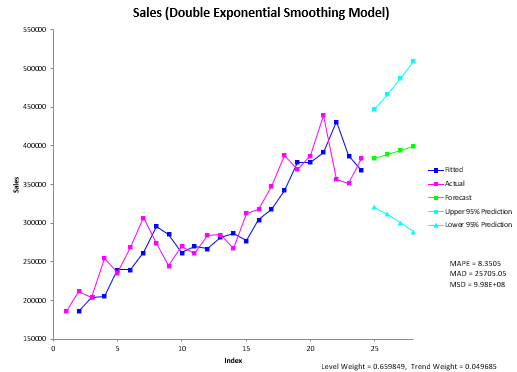
- Double Exponential Growth
- Winter's Method
- Moving Average
Why Use Time Series Analysis in SPC for Excel?
SPC for Excel easily performs time series analysis using one of the above techniques. A time series is a series of data points in time order, taken at successive equally spaced points in time, such as daily, yearly, etc. A time series is plotted over time as a run chart. There are potentially three components in a time series analysis: level, trend and seasonal.
- One use of time series analysis is to forecast future values based on history.
- Another objective is to find patterns in the data that can be used to extrapolate those patterns into the future.
Get These Time Series Analysis Features
- Compare models using mean absolute percentage error (MAPE), mean absolute deviation (MAD), or mean squared deviation (MSD)
- Forecast future points
- Includes prediction limits for future points
- Enter values for level, trend or forecast weights or let SPC for Excel find them by minimizing the error
I like that it works within Excel as an add-in so I don't have to download something extra. I also really appreciate all the online help offered and the reasonable price.
Douglass B.