December 2004
In this issue:
Customers expect a consistent quality product that meets their specifications as it is produced – not by sorting or rework. We have seen how control charts can tell us if our product’s quality is consistent, but control charts do not tell us if the product is meeting customer specifications. To determine that, we must return to histograms.
Histograms graphically display the variation in a process. Once our process is in control, we know that if we take samples and construct a histogram from yesterday’s, today’s, or tomorrow’s product, the histogram will look basically the same in terms of shape, average, and standard deviation.
For processes that are in statistical control and that are normally distributed, we can do a Process Capability Analysis. Part 1 of this series contained an explanation of process capability and introduced one metric (Cp) to measure process capability. Last month we introduced the second process capability, Cpk, and demonstrated how Cpk is calculated. This month, we conclude our discussion of process capability by introducing the process performance indicator Ppk and comparing it to the process capability indicator Cpk.
Cpk Review
What is process capability? Process capability represents the performance level of the process after it has been brought into statistical control (see the January 2004 e-zine on variation and the April 2004 e-zine on interpreting control charts). Process capability is the range of natural variation in the process that is due to common causes.
One of the best everyday descriptions of process capability comes from a car and a garage. The garage defines the specification limits. The width of the garage is the engineering tolerance (see October 2004 e-zine). The width of the car represents the natural variation in your process. If your car is just a little smaller than the garage, you have to be very careful putting the car in the garage. If you want to get the car in without scratching it, you have to park right in the middle of the garage (the center of the specification limits). Now, if your car is wider than your garage, there is no way you can get it into the garage. It is not “capable.”
If your car is much smaller than the garage, it is easy to park the car in the garage. It does not have to be in the center. It will still fit and you will have room on either side. This is what process capability is about. If your process is in control and has little variation, you should be able to meet your customer specifications. Cpk tells you the relationship between the width of the car, the width of the garage and how far away from the middle you parked your car.
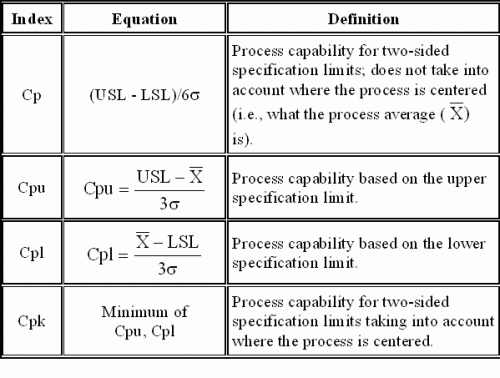
There are four basic metrics used to measure process capability: Cp, Cpu, Cpl and Cpk. These are summarized in the figure and were covered in detail in the last two e-zines.
The following is true for two-sided specifications:
a. If the average line on the control chart is equal to the center of the specifications, then Cpk = Cp.
b. Cpk will always be less than or equal to Cp.
Sigma’s Role in Cpk
The standard deviation (s) is used in the denominator for the calculation of Cpk and Cp. This estimated standard deviation is calculated from the range or s control chart using one of the equations shown in the figure.
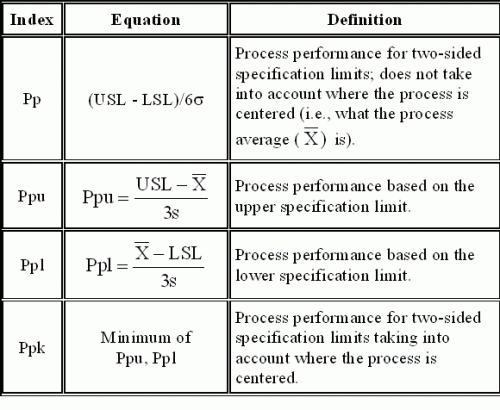
The process performance indices (Pp and Ppk) do not use this method to determine the standard deviation.
Ppk

This is the calculated standard deviation (s) of the individual values and does not take into account whether or not the process is in control. It is the value you obtain using Microsoft Excel’s built-in function STDEV. The calculations for Pp and Ppk are shown in the figure below.
Cpk or Ppk?
So, which is best to use? Cpk or Ppk? Remember, Cpk is used to determine if the process is capable of meeting specifications. It may be short term or long term, depending on the amount of data present. The process has to be in statistical control. A process that is in statistical control is consistent and predictable. You know what your process will produce (within the range of natural variation) in the future. So, Cpk is a prediction of what your process can do. It is the better of the two indices for process capability. If your process is in control, Cpk and Ppk will be essentially the same.
A word of caution. Some software programs actually calculate Ppk and call it Cpk. Be sure which one your software does.
Summary
This month contained the final part of our series on process capability. We reviewed Cpk and introduced Ppk. The only difference between these two measures is how the standard deviation is calculated. With Cpk, the value of sigma is estimated from a range or standard deviation control chart. With Ppk, the value of sigma is calculated from all the data.


