May 2014

You just missed a very important piece of information about your supplier’s performance. Know what it is?
In this publication:
You may download a pdf copy of this publication at this link.
Introduction
This is the third in a series of SPC Knowledge Base publications on process capability. Two months ago, we took an interactive look at process capability. We reviewed the process capability calculations, including Cp and Cpk. You could download an Excel workbook that let you visually see how changing the average and standard deviation of your process impacts your process capability. You were able to see visually how the process shifts versus your specifications. In addition, the workbook showed how Cp, Cpk, the sigma level, and the ppm out of specification changed as the average and standard deviation changed. If you are new to process capability, please take a moment to review that publication.
Last month’s publication was entitled “Cpk Alone is Not Sufficient.” In that publication we took a look at the why a Cpk value by itself is not sufficient to describe the process capability. We went through a process capability checklist designed to help you paint a true picture of your process capability – to increase the confidence you, your leadership, and your customers have in your process capability.
We did not mention Ppk in either publication. Time to change that in this publication.
Process Capability Review
Process capability analysis answers the question of how well your process meets specifications – either those set by your customer or your internal specifications. To calculate process capability, you need three things:
- Process average estimate
- Process standard deviation estimate
- Specification limit
This is true for both Cpk and Ppk. We will assume that our data are normally distributed.
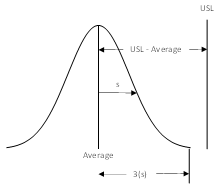
Process capability indices represent a ratio of how far a specification limit is from the average to the natural variation in the process. The natural variation in the process is taken as being 3 times the process standard deviation. Figure 1 shows the general set up for determining a process capability index based on the upper specification limit (USL) with “s” being a measure of the process variation.
Figure 1: Determining a Process Capability Index
The process capability index is then given by:
Process capability index = (USL – Average)/(3s)
To calculate process capability, you need to be able to estimate the process average and the process standard deviation. And no, it is not as easy as simply doing some calculations. Both of these statistics have to be “valid.” We explore this more detail below.
Cpk and Ppk Review
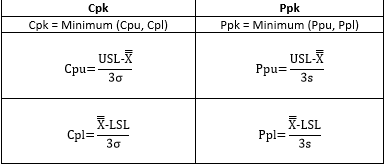
Both Cpk and Ppk are the minimum of two process indices. The equations for Cpk and Ppk are shown in Table 1.
Table 1: Cpk and Ppk Equations
The X with double bar over it is the overall average. In the Cpk equations, σ is used to estimate the process variation. σ is the estimated standard deviation obtained from a range control chart. In the Ppk equations, s is used to estimate the process variation. s is the calculated standard deviation using all the data.
Thus, the major difference between Cpk and Ppk is the way the process variation is estimated. So what is the difference between these two?
Within Subgroup Variation vs Overall Variation
The question of Cpk vs Ppk is really a question of within subgroup variation, σ, vs overall variation, s. Let’s start with s or the calculated standard deviation, which is given by the equation below.
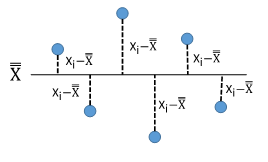
N is the total number of data points. Look at the summation term under the square root sign. This term is squaring how far each individual data point is from the overall average, as shown in Figure 2.
Figure 2: Standard Deviation (s)


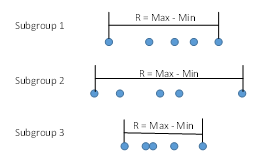
Figure 3: Within Subgroup Variation (s)
R is a measure of the variation within the subgroup. To calculate σ, you use the following equation:
Ris the average range and d2is a control chart constant that depends on subgroup size. So, σ accounts for the variation within the subgroup. It may or may not account for all the variation as we will see below.
That Little Issue of Statistical Control!
All our publications on process capability have stressed the need for the process to be in statistical control. How often is this just ignored? Last month we gave the process capability checklist developed by Dr. Don Wheeler to paint a true picture of your process capability. That checklist had five items:
- Plot your data using a control chart to determine if the process is in statistical control (consistent and predictable)
- For a process that is in statistical control, construct a histogram with the specifications added
- For a process that is in statistical control, calculate the natural variation in the process data
- For a process that is in statistical control, calculate Cp and Cpk
- Combine these four items together and present them all when talking about process capability

- If Cpk is approximately equal to Ppk, the process is in statistical control
- If Cpk is significantly different than Ppk, the process is not in statistical control
So, when you looked at the supplier chart and noticed a big difference between Cpk and Ppk, you were given a key piece of information. Your supplier’s process is not in statistical control – and you can’t be sure of what you will get in the future.
In addition, if the process is not in statistical control, Cpk and Ppk have no meaning. You cannot be sure of getting similar values in the future because the process is not consistent and predictable. We will explore this further in the following example for two processes with the same data – just in a different order.
Two Processes – Same Data, Same Ppk
We will use two processes that have the same data (the data from last month’s publication). Suppose you are taking four samples per hour and forming a subgroup. You want to determine if your process is capable of meeting specifications (LSL = 65 and USL = 145). The data for the 30 subgroups for Process 1 are shown in Table 2.
Table 2: Process 1 Data
| Day | X1 | X2 | X3 | X4 | Day | X1 | X2 | X3 | X4 | |
| 1 | 90.2 | 113.8 | 111.8 | 104.4 | 16 | 100.8 | 106.0 | 101.5 | 108.8 | |
| 2 | 105.6 | 98.8 | 109.3 | 113.5 | 17 | 96.7 | 101.3 | 100.4 | 95.1 | |
| 3 | 104.0 | 84.5 | 98.9 | 97.0 | 18 | 105.1 | 92.0 | 92.5 | 95.0 | |
| 4 | 112.4 | 86.2 | 85.5 | 106.5 | 19 | 104.5 | 94.5 | 91.3 | 82.7 | |
| 5 | 96.6 | 99.9 | 112.9 | 96.8 | 20 | 110.1 | 110.7 | 104.0 | 115.6 | |
| 6 | 91.7 | 101.3 | 107.1 | 101.2 | 21 | 116.9 | 86.3 | 96.4 | 99.3 | |
| 7 | 112.0 | 97.9 | 109.0 | 95.2 | 22 | 78.9 | 91.4 | 96.5 | 109.2 | |
| 8 | 91.8 | 98.0 | 98.1 | 79.2 | 23 | 112.2 | 110.5 | 98.3 | 109.2 | |
| 9 | 94.9 | 87.1 | 104.3 | 112.7 | 24 | 88.8 | 105.9 | 86.3 | 76.0 | |
| 10 | 101.1 | 104.0 | 101.1 | 102.7 | 25 | 98.6 | 93.5 | 106.2 | 92.8 | |
| 11 | 100.6 | 83.3 | 96.6 | 88.5 | 26 | 99.1 | 99.6 | 83.6 | 106.5 | |
| 12 | 80.5 | 95.0 | 98.3 | 113.6 | 27 | 90.5 | 110.0 | 82.6 | 86.0 | |
| 13 | 89.2 | 93.9 | 98.5 | 106.7 | 28 | 106.7 | 107.9 | 109.9 | 108.8 | |
| 14 | 96.7 | 96.8 | 106.2 | 90.0 | 29 | 87.4 | 95.0 | 108.5 | 96.7 | |
| 15 | 74.2 | 104.3 | 111.2 | 108.7 | 30 | 112.7 | 78.4 | 112.8 | 81.1 |
The data for Process 2 are the same, just in a different order. These data are shown in Table 3.
Table 3: Process 2 Data
| Day | X1 | X2 | X3 | X4 | Day | X1 | X2 | X3 | X4 | |
| 1 | 105.6 | 113.5 | 107.1 | 101.2 | 16 | 92.0 | 92.5 | 95.0 | 96.6 | |
| 2 | 112.4 | 109.3 | 104.0 | 101.3 | 17 | 90.5 | 96.7 | 82.6 | 86.0 | |
| 3 | 104.3 | 112.7 | 112.0 | 100.6 | 18 | 101.1 | 104.0 | 101.1 | 102.7 | |
| 4 | 104.3 | 111.2 | 108.7 | 113.6 | 19 | 100.8 | 106.0 | 101.5 | 108.8 | |
| 5 | 101.3 | 100.4 | 95.1 | 106.7 | 20 | 110.1 | 110.7 | 104.0 | 115.6 | |
| 6 | 105.1 | 116.9 | 109.2 | 110.0 | 21 | 112.2 | 110.5 | 112.8 | 109.2 | |
| 7 | 104.5 | 112.9 | 105.9 | 109.9 | 22 | 94.5 | 91.3 | 82.7 | 91.7 | |
| 8 | 108.5 | 108.8 | 106.7 | 107.9 | 23 | 86.3 | 96.4 | 99.3 | 80.5 | |
| 9 | 106.5 | 106.2 | 106.2 | 98.8 | 24 | 88.8 | 74.2 | 86.3 | 76.0 | |
| 10 | 86.2 | 85.5 | 106.5 | 84.5 | 25 | 113.8 | 111.8 | 104.4 | 112.7 | |
| 11 | 97.9 | 109.0 | 95.2 | 98.9 | 26 | 98.6 | 93.5 | 95.0 | 92.8 | |
| 12 | 83.3 | 96.6 | 88.5 | 97.0 | 27 | 99.1 | 99.6 | 83.6 | 96.7 | |
| 13 | 95.0 | 98.3 | 94.9 | 99.9 | 28 | 78.4 | 98.3 | 81.1 | 87.4 | |
| 14 | 89.2 | 93.9 | 98.5 | 96.8 | 29 | 78.9 | 91.4 | 96.5 | 90.2 | |
| 15 | 96.7 | 96.8 | 87.1 | 90.0 | 30 | 91.8 | 98.0 | 98.1 | 79.2 |
Since they are the same, the data in Tables2 and3 have the same average and the same standard deviation.
Average = 98.98
Standard deviation (s) = 9.89
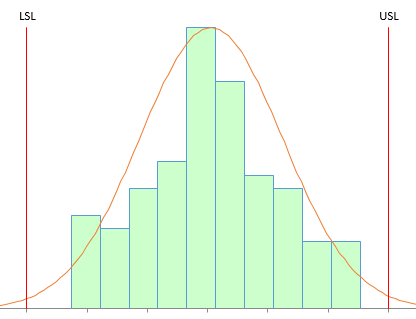
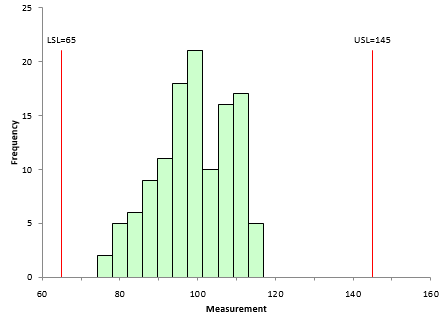
Now draw a histogram for the data in Table2 and a histogram for the data in Table 3. Throw in the specifications: LSL = 65 and USL = 145. If you do this, you will discover that the histograms are exactly the same – just what you expect since the data are the same. Figure 4 shows the histogram.
Figure 4: Histogram of Process Data with Specifications Added
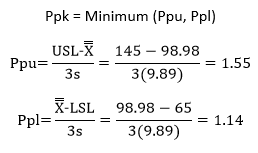
This process looks very good – definitely within the specifications. You are one happy person. You can calculate Ppk for Process 1 and Process 2. Since the average and standard deviation are the same, Ppk will be the same for both processes. The calculations are:
So, Ppk = 1.14 for Process 1 and Process 2.
Two Processes – Same Data, Different Cpk
But wait – what is the value for Cpk for these two processes? Are the same? No, they are not the same. Remember Cpk is based on the within subgroup variation. And although the data are the same in both processes, they are in different order – which changes the within subgroup variation. To calculate the Cpk values, you need to estimate the standard deviation (s) from the range chart and the overall process average from the X chart. This is a very important difference between the Ppk approach and Cpk approach. Ppk simply uses calculations; Cpk uses control charts to estimate the average and the process variation. It is the way you tell the future about your process.
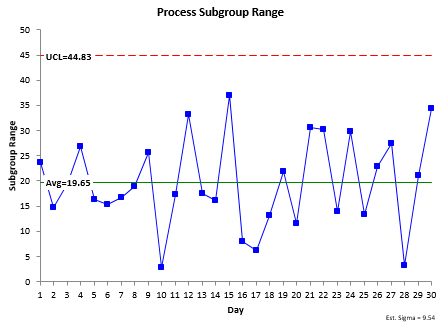
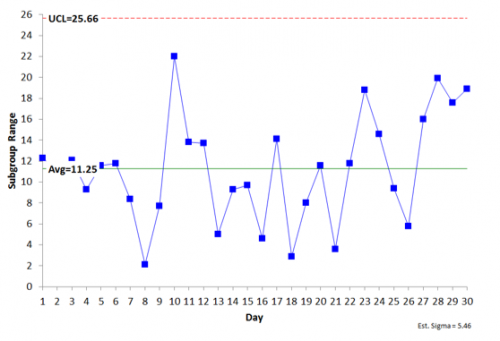
The control charts for Process 1 are shown below. The range chart is shown in Figure 5.
Figure 5: Process 1 Range Chart
The range chart is in statistical control. Because it is in control, it is consistent and predictable. You can now estimate the standard deviation using the following:
Note that since the range chart is in statistical control, the within subgroup variation is consistent and predictable. The value for the process standard deviation is “valid.” The process that generated it is consistent and predictable and will remain so as long as the process stays the same.
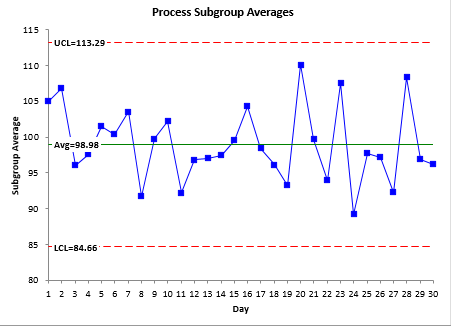
To calculate Cpk, you need an estimate of the average. That comes from the X control chart. Figure 6 shows this chart.
Figure 6: Process 1 X Chart
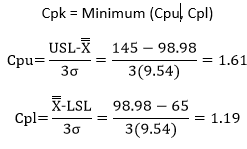
The X chart is in statistical control. This means that you have a good (“valid”) estimate of the process average. You can now use that average, along with s to determine the Cpk values
.
Now compare the results for Ppk and Cpk for Process 1:
| Process 1: Ppk | Process 1: Cpk |
| s = 9.89 | s = 9.54 |
| Ppu = 1.55 | Cpu = 1.61 |
| Ppl = 1.14 | Cpl = 1.19 |
Note how close the results are. This will always be the case when the process is in statistical control. This is because of the following:
When a process is in statistical control, the within subgroup variation is a good estimate of the overall process variation, i.e., σ= s.
Cpk is essentially the same as Ppk in this case. They are giving you the same information.
Let’s move on to Process 2. The range chart for Process 2 is shown in Figure 7.
Figure 7: Process 2 Range Chart
The range chart is in statistical control – the within subgroup variation is consistent and predictable. You can now estimate the standard deviation using the following:
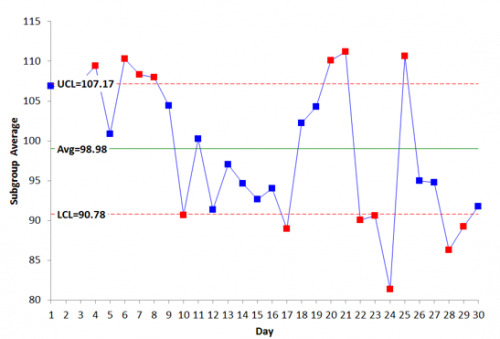
Again you need an estimate of the average to determine Cpk. This comes from the X̅ chart, which is shown in Figure 8
Figure 8: Process 2 X Chart
The X chart is not in statistical control – the between subgroup variation is not consistent and predictable. There are points beyond the control limits, runs above the averages – all sorts of problems with the stability of this process.
This means that you do not have a good estimate of the process average. It is moving around. What will the next subgroup average be? You have no idea where it will be. The process is not consistent and predictable. You can’t really calculate the Cpk value.
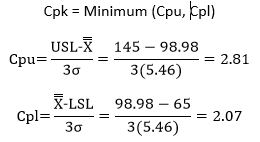
Many times folks just simply ignore this fact and move full steam ahead with calculating Cpk. After all, the calculated average is 98.98. The Cpk calculations are as follows:
So, Cpk for Process 2 is 2.07. Now compare the results for Process 1 and Process 2.
| Processes 1 and 2: Ppk | Process 1: Cpk | Process 2: Cpk |
| s = 9.89 | s = 9.54 | s = 5.46 |
| Ppu = 1.55 | Cpu = 1.61 | Cpu = 2.81 |
| Ppl = 1.14 | Cpl = 1.19 | Cpl = 2.07 |
The values of Cpu and Cpl for Process 2 are significantly different than the Ppu and Ppl values. And it all boils down to the issue of statistical control. When there are significant differences in σ vs s, Cpu vs Cpl and Cpl vs Ppl, it is a very strong indication that the process is not in statistical control.
Summary: So, Who Wins: Cpk or Ppk?
The reality is that Cpk is a better estimate of the potential of your process. It represents the best your process can do and that is when the within subgroup variation is essentially the same as the between subgroup variation. This is what it means to be in statistical control. And if the process is in statistical control, Cpk is essentially the same as Ppk. So, you really don’t need Ppk in this case.
And if your process is not in statistical control, you have something to work on – Cpk and Ppk are pretty well meaningless – except for the fact that values of Cpk and Ppk that are widely different are indications that the process is not in statistical control.
But you know that already because you are following the process capability checklist from Dr. Wheeler. Always start by looking at the data in control chart format.




Hi!!I am a regular reader of all the articles posted on your website and they are really very informative as well as useful. Thanks a lot for posting.While going through this article i feel it need corrections in two places:1. We are differentiating standard deviation between Cpk and Ppk with the help of sign s & sigma. But i have seen in formules we have used these signs but when i see the explanation then in both cases we are using "s" as symbol for standard deviation. It is creating little confusion while understading the difference.2. You mentioned above checlist of 5 terms as adviced by Dr. don. In case of first point it is clearly mentioned that we need to construct the control chart to see if our data is in statistical control. Now the limits or we can say natural variation is already calculated in this first point so why are we asked to do same in point number 3 " For a process that is in statistical control, calculate the natural variation in the process data".Kindly clear these doubts.Thanks again for posting such a wonderful posts…RegardsAshok Pershad
Hello. Thanks for your comment. Yes, different books/articles/people handle s and sigma differently – or call them both s as you said. There is not consistency in the approach. It would be better to use the terms the “within” and “overall” to describe which one you are talking about. I typcially use “s” for the overall and “s” for the within.
The natural variaiton is not the same as the control limits. THe natural variation is 6s. The control limits are based on what you are plotting, i.e., the subgroup averages in the examples in this article.
Best Regards,
Bill
What is the defination of natural variation and how do you calculate it? Is it the Cp calculation?
Hello, the natural variation is 6 times sigma. See above how it is caculated. It is the denomiator of Cp
Thanks really helpful. since it is in simple and plain hence carries no confusion. I have been regular reader of your articles.
hello bill Could you please explain how you calculate UCL and LCL in X-bar chart you shown in your article. Generally UCL= X-bar+3* sigma and LCL=X-bar-3*sigma. Please explain this!!
The controls limts are referred to as three sigma limits, but it is three sigma limits of what is being plotted. In this case, that is subgroup averages. Plus the value of sigma is estimated from the average range. We have a two part series on Xbar-R control charts in the SPC Knowledge Base. The first part is here:
https://www.spcforexcel.com/knowledge/variable-control-charts/xbar-r-charts-part-1
We also have an article that explains where control lmits come from:
https://www.spcforexcel.com/knowledge/control-chart-basics/control-limits
Let me know if these do not answer your questions.
Bill
Good article, but it would be nice if you had an arrows with explanation how you call it each element in formula.
What do you suggest is more valuable when the subgroup of the control chart is 1? Is there any value in estimating sigma from a range chart? or the overall variation is better and consequently Ppk is more valuable? What are your thoughts?Thank you
When individual values are used, the moving range chart is used to estimate sigma. The moving range chart uses the range between consecutive points. So, sigma estimated from the average moving range still looks at the variation in individual values. I don't think it makes a difference if individuals values are used or subgroups are used. I still find Cpk more valuable because it says what the proess is capable of doing in the short term. Of course, if in control, Cpk and Ppk will be the same essentially.
Thank you very much. Good explanation, need just 5 minutes to understand this concept.
Hi Bill,You have said that the X bar chart for the process is not stable and the points are not in control limits, Then how could we rely on cpk value. Because for an inconsistent process it shows the value to be higher than 2. So how could you conclude that cpk is better and ppk.Dont know whether my understanding is wrong. please explain. Thanks
Hello. The point I am trying to make is that many people just calculate the Cpk value without considering whether or not the process is in statistical control. This one is not. So the Cpk value has no meaning – nor does the Ppk value. Since the process is not in control, you have no idea of what hte results will be in the future. To have meaning, the process has to be in control. If it is, then Cpk and Ppk will be very close.
Hi Bill,First thanks for your information, it's really useful.I have two questions.1.many people think PPK is one index that already consider speical cause and common cause ,thus they also think there's no need to consider if the process is in statistical control or not before caculating PPK.I saw you said if not in statistical control, CPK and PPK are both meaningless, how do you understand the difference?2.Whatever the process is in development or after mass production, always caculate CPK first?
If your process does not show some degree of consistency (being in statistical control), it is impossible to know what the near term future looks. You don't know where the process will be so, calculating anything on that process (average, Cpk, Ppk, etc.) doesn't give you any real information because you won't get similar results in the future. If you have lots of data the impact of special causes can be less when calculating the standard deviating but not from estimating it from a range control chart. I would always calculate Cpk, but you can calculate both. If they are similar, the process is probably in control.
if the Cpk more than Ppk . what does it mean?
If there is a large difference between the two, it usually means that the process is not in statistical control.
Hi Bill, In the equation below figure 5 and again in the equation below figure 7 you use 2.059 for d2. But there are 30 observations in the sub group for the averages. Why use the d2 for a subset of 4? Was that arbitrary?
d2 is a constant based on subgroup size, in this example, 4 since there are four samples per subgroup. Yes, my choice of 4 was arbitrary for this example.
Excellen material
Hello Bill, Really great article about SPC.! I got one question, the only purpose of calculating PPK seems to compare with CPK in order to see if the process is in statistical control or not. PPK looks quite meaningless, doesn't it? There are different articles/opinions that CPK/PPK reprents short/long term capability of process, how do you think? THANKS!
Thanks. Short and long term. Yes i have read those. Usually Cpk is short tand Ppk is long. It is a matter of how quickly your process changes i image. Only use for Ppk is if you can't get your process under control ever. But in that case you never know what it will be next time. So, quite meaningless actually as you say.
I haven't seen tables with d2 for a subgroup of 1 but ussing your logic about the difference between Cpk and Ppk when the values are shuffled I will think that for both the value will be the same?How do you calculate cpk for a subgroup of 1?
If there are individual values, the average range is the average of the range between consecutive samples. d2 is 1.128 in that case.
I love your blog.. very nice colors & theme.
Did you create this website yourself or did you hire someone to do
it for you? Plz respond as I'm looking to construct my own blog and would
like to know where u got this from. thanks
Please email me at bill@www.spcforexcel.com.
Hi, My question is how did you get the value of d2 is 2.059? Could you explain?
d2 is a control chart constant that depends on subgroup size. For n = 4, the value of d2 is 2.059. For more information, please see this link: https://www.spcforexcel.com/knowledge/control-chart-basics/control-limits
The example throws me off. I get it that the goal is to be consistent, but in all things process related error closer to zero is good – or in this case Cpk greater is better. In the second data set the limits pull in naturally because the data shows higher consistency. While that does produce control charts that show greater variance from the norm based on the small sample it still exceeds the process requirements. If a process control chart results in a Cpk increase (bigger is better) why would this mean the process is out of control? The x-bar hart in data set 2 shows out of range based on the small set, but the ultimate goal of exceeding expectations is being met. The process should not be compromised because a subset performed well and had some outliers that still fell into the greater range. Did I miss something?
Hello David,
It is all about consistency. Unless your process is in control you can't predict what it will make in the future. So even though an 'out of control" process is within specification, it is not good – for your or your customer probably. Bringing it into control with reduce the variation and make the process even better. Cpk increasing does not mean that hte process is out of control. Cpk has no meaning if the process is out of control because you don't know the average or the variation.
When you say Cpk has no meaning if the process is out of control because you don't know the average or the variation, I disagree based on your example. If your Ppk is less than your Cpk you are closer to, not futher from, your average. And your variation is better than, not worse than, your established benchmark. This would indicate your process is performing in control, not out of control. It would indicate you could improve your process and the data is telling you that you could do better, but that would be a business decision. It would make no sense at all to start looking for ways to decrease your Cpk to bring it closer to your Ppk in your process because it is becoming more consistent. If your example was indicating Cpk dropping consistenly lower than Ppk then I would agree with this example, but this is not the case – your example shows Cpk significantly better than Ppk – which is good and in control.
You can, of course, chose not to look for a special call of variation. You just miss that opporutnity to hopefully find and remove the reason for the special cause. The purpose of this article was to say that, if your process is in stastical control, Ppk and Cpk will the same, as shown in the first example. If they are signficanlty different, then that is an indication that your process is not in control – it is not consistent and predictable. You can't be sure of getting similar results later in the process.
Hi Sir, Based on the example given, before calculating cPk the data isnt verified for natural distribution. The data provided is resulting in p value 0.039 (Using Anderson Darling test for Normality must be greater than 0.05) which denotes data is not following a normal distribution (Considered 120 data points from example). Now, whether cPk can be calculated for a data which doesnot follow natural distribution without transforming the data?Please clarify / correct me..Thanks in advance
I didn't worry about checking normality because the histogram looks close enough to me. Also remember that the Anderson-Darling test will give wrong indications for large data sets – which 120 probably is. If you take the first sample from each subgroup and run the normal probably plot wtih those 30 points, the p value is .79 – which says it is normally distributed. For large data sets, rely on the histogram – not the normal probability plot – to decide about normality – and of course your knowledge of the process.
I noticed the same as I was replaying it in Minitab 21. But if you change the dataset numbers
Table 2 Table 3
113,6
X4
113,6
X4_1
113,8
X2
113,8
X1_1
115,6
X4
115,6
X4_1
116,9
X1
116,9
X2_1
Into
Table 2 Table 3
113,6X4113,6X4_1
113,8X2113,8X1_1
116,9X4116,9X4_1
118,8X1118,8X2_1
Than the p-value goes to 0,057 which is normally distributed and your story , which is very explanatory is more correct.
HiCan you tell my observation is Right or Wrong? 1. When between subgoup variation is more 1a. Material batch variation. 1b. Operator variation 3c. May be measurement variation. from one sub group to another subgroup.With in sub group variation is less wehn Machine give the output (Standard deviation) range is same.Kindly reply I am right or wrong
I am not sure I understand what you are asking. If the between subgroup variation is much larger than the within subgroup variation, the control limits will be very tight and you should look at using a Xbar-mR-R chart.
In the automotive manufacturing industry, the standard for when to use Ppk and Cpk differs some. Maybe you could validate or explain the reasoning for this. In the automotive industry, Ppk is used for initial process studies and is based off a single run. Cpk is used to determine capaibility over multiple runs. My understanding of this is because Ppk is a measure of process performance, and Cpk is a measure of process capability. And until you introduce all the different sources of variation such as component lot to lot, operator, changeover… etc, you cannot say the process is stable or capable. And this needs to be done over multiple runs. From a single run you can only analyze the current performance. And that is why for initial process studies with a single run, Ppk is used to evalauate the performance of the process and determine whether it meets the expectations.
Thanks for the insights. I agree with what you say. A true process capabilty study has to have the potential sources of variation present.
Hi Dr. Bill, Thanks for the excellent explanation of Ppk vs Cpk. I understood it. I just have a question on the control charts shown. I believe that the LCL and UCL are calculated based on +/- (A2 * R-bar). My thinking was that the value for A2 * R-bar should be close to 3 sigma where sigma is the standard deviation of the sub-group averages. I was working out the numbers on Process 2 and these values are far apart. Appreciate your comment…….Regards/Ram
what's need to be calculate during Part Devoplement and why ???
Is cpk value 9 is good?Any how it is more than 1.67 which is acceptance criteria for that parameter.Is there any Ideal value like from 1.33 to 2.00??!!
The higher the Cpk value, the better. 9 is very high, I seldom see one that high. What is acceptable depends on you and your cusotmer.
Very nicely explained the difference; would like to know also abot short term and long term sigma
Hi Bill, great info. Do you know where I can find Ppk ranges (like a table) and what ranges are capable and which are not? From what I've read, Ppk values >1.33 are robust, 1.0<Ppk<1.33 are capable and Ppk values <1.0 are said to be out of control. Thanks for your help!
A Ppk value less than 1 is not capable – the process is not capable of meeting specifications. It could be in statistical control though. A Ppk vaue greater than 1 is capable. The desired value of Ppk is usually > 1.33 now.
Hello Bill,Nice content of article as well as presenation.Just to know that , PpK is used in development stage but in development stage there is results of only 03 to 05 batches, so can we still calculate PpK value ?One more confusion: In commercial stage : what shall be calculate if we have 20 batches manufactured in one year and each batch have one reading of Assay. How to conclude the process?
In the development stage, you use whatever if you have – that is all you can do. You can calculate process capability. Also with the 20 batches a year – that is all you have so you just use that data.
if the data distribution is non-normal , one should transform the data using box-cox or Johnson transformation . But, what about the specification limits? How should one transform those ? Thank you for the article, Bill . Regards
You use the same equation that is used for the individual data points – just put in the specs.
Thank you very much for these useful informations.
Need for Analysis .
Do identified assignable special variation dtaa points are included while performing Ppk analysis? Please someone answer?
My rule of thumb is that if you know the reason for the assignable cause and have corrected it, you may remove it from the calculations. With enough data, it won't make much of a difference most likely.
Do identified assignable special variation dtaa points are included while performing Ppk analysis? Please someone answer?
Thanks
Hi Bill, I have some confusions in concept of Cpk and Ppk while using practically these tools. Let say cycle time of my process is 5 hours and batch size is 100000 pieces. So. if i want to calculate Cp & Cpk for short term analysis then should i take some sample pieces (say 50 pieces) at start of process and calculate Cp & Cpk on the gathered data samples. Then run process and for long term analysis (Pp & Ppk) i collect samples of 20 pieces after every 50000 pieces or every 1 hour then calculate the Pp & Ppk with help of this data. I want to ask my understanding of short term and long term is right or wrong, if wrong please correct me.
One more question is i read in different articles that for Pp and Ppk whole population is considered for the study so in above case whole population will be 100000 pieces or as i am using 20 pieces after defined frequency can also be considered as whole population?
Thanks for your time
Hello,
You can calculate Cp and Cpk as you indicated after getting 50 pieces. Pp and Ppk usually are a longer time period – all the data if you have it. If you process is in control, the results will be about the same whether you take it long term or short term.
Why process is not acceptable if cpk is 1.3 and ppk is 3.4
Where do you see this in the publication? I don’t see a Ppk of 3.4 anywhere. But with that big a difference between Cpk and Ppk, I would say that the process is out of control most likely.