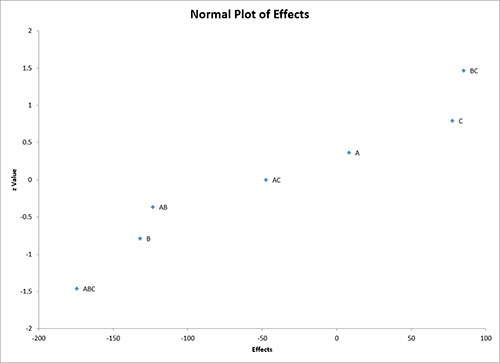
This sheet contains the normal plot of the effects. The output from this example is shown below. The effects are plotted on the x-axis and the z-values on the y-axis. You can use this chart to determine what effects are significant. Significant effects are those that tend to fall off an imaginary straight line drawn through most of the points.
In this case, a straight line fits easily through effects B, ABC, BC and AB. This leaves A, C and AC off the straight line making them probable significant effects. The half-normal plot represents another process for doing this.