ANOVA Gage R&R Help
Home » SPC for Excel Help » Analysis Help » Measurement Systems Analysis Help » ANOVA Gage R&R Help
This help page shows how to setup and run the ANOVA Gage R&R for a crossed design. This is the design where multiple operators repeatably measure multiple parts. The data used in this example can be downloaded at this link.

- 1. To start the analysis, select “MSA” from the “Analysis” panel on the SPC for Excel ribbon. Then select “Gage R&R Studies” and “Crossed-ANOVA”.
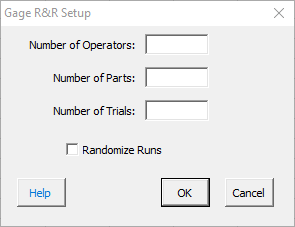
- 2. The input form below is shown. Enter the number of operators, parts and trials. You also have the option to randomize the runs in the study. Select OK.
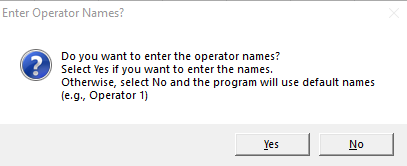
- 3. The option to enter the operators’ names is given. If you select No, the software lists each operator as Operator 1, Operator 2, etc. If you select yes, then an input form is shown for each operator so you can enter the name.
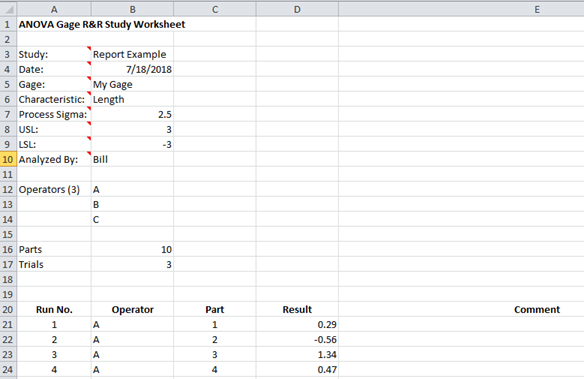
- 4. An ANOVA Gage R&R worksheet is added to the workbook. This is where you enter the information and results.
- 5. Enter the information into the top part of the worksheet. There is a comment in each cell in rows 3 to 10 in column A that explain the entry. All entries are optional. Each entry is explained below.
- Study: optional,name of study
- Date: optional, date Gage R&R performed
- Gage: optional, name of gage
- Characteristic: optional, characteristic being measured
- Process Sigma: optional, value used for the total variance instead of the calculated total variance of the Gage R&R results
- USL: optional, used to determine % of tolerance explained by study variation
- LSL: optional, used to determine % of tolerance explained by study variation
- Analyzed By: optional, name of person doing the analysis
- 6. Enter the run number, the sample result for each combination of operator and part and any comments (optional).
- 7. Part of a completed ANOVA worksheet is shown below.
- 8. The results are now ready to be analyzed using the ANOVA method. To analyze the results, select “MSA” from the “Analysis” panel on the SPC for Excel ribbon.
- 9. The following options are displayed.
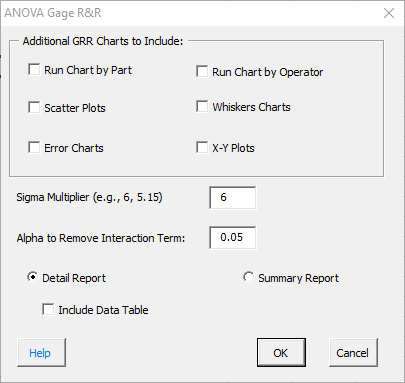
The options are explained below.
- Six additional charts can be created
- Run chart by part
- Run chart by operator
- Scatter charts
- Whisker charts
- Error charts
- X-Y Plots
- Sigma Multiplier: the value that standard deviation is multiplied by. The default value is 6. This captures 99.73% of the data. 5.15 is sometimes used. This value captures 99% of the data.
- Alpha to remove the interaction term: if the p value for the interaction term is above this value, it is removed from the ANOVA calculations. The default value for alpha is 0.05.
- Detailed or Summary Report: both are displayed on single worksheet. The detailed report contains all the charts, calculations and explanation of results. The summary report contains the charts.
- Data Table: the option to include a data table in the report.
Any of the six additional charts selected are added to a new worksheet.
Select OK to generate the report in the workbook.
- 10. A pdf file containing the detailed report with a description of the output is given at this link. The output includes:
- ANOVA table with interaction
- ANOVA table without interaction (if the interaction can be removed)
- % Contribution based on variance
- % based on standard deviation
- Number of distinct categories
- Variance components chart
- Operator-part X-R charts
- Control chart calculations
- X chart analysis
- R chart analysis
- ANOM chart
- ANOR chart
- ANOM calculations
- Main effect chart analysis
- Mean range chart analysis
- Data table
Please see the link above for more information on the output.