Pareto Diagram Complete Teaching Guide
$79.00
Out of stock
A Pareto diagram is a data-based approach to determine what the major problem or cause is. All companies have lots and lots of problems on which to work. There is not enough time in our day to work on everything. The Pareto diagram gives us a way to determine which problem to work on first – where we will get the most return for our investment.
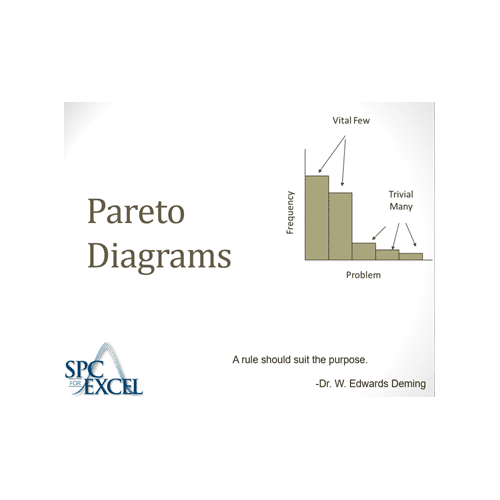
The purpose of this module is to introduce the Pareto diagram – what it is, when to use it and how to construct a Pareto diagram. Vilfredo Pareto, an Italian economist, developed the Pareto diagram in the late 1800s. He discovered that 80% of Italy’s wealth was held by 20% of the people. This has become known as the 80/20 rule or the Pareto principle. It is at the heart of the Pareto diagram. The 80/20 rule applies in many places – 20% of our customers are responsible for 80% of the customer complaints; 20% of the workforce account for 80% of employee issues. The Pareto diagram is one method of separating that 20% – the vital few – from the 80% – the trivial many. This allows us to focus our time, energy, and resources where we will get the most return for our investment.
This module includes:
- Handout (16 pages)
- Teaching Guide (3 pages)
- Solutions to Exercises (3 pages)
- PowerPoint Presentation (41 slides)
- Excel Workbook Containing the Data
- Excel Workbook Containing the Solutions