Our first two blogs in this process capability series answered two questions: What is process capability? – and – What is Cpk? This blog answers the next question: What is Ppk?
The answer is quite simple. Just to refresh your memory, Cpk is expressed as the following:
Cpk = Minimum (Cpu, Cpl)
Cpu=(USL-X)/3s
Cpl=(X-LSL)/3s
where Cpu is the capability based on the upper specification limit (USL), Cpl is the capability based on the lower specification limit (LSL), X is the overall average, and s is the estimated standard deviation from a range control chart. Cpk is the minimum of Cpu and Cpl.
Ppk is expressed as the following:
Ppk = Minimum (Ppu, Ppl)
Ppu=(USL-X)/3s
Ppl=(X-LSL)/3s
where Ppu is the capability based on the upper specification limit (USL), Ppl is the capability based on the lower specification limit (LSL), and s is the calculated standard deviation from all the data. Ppk is the minimum of Ppu and Ppl.
Look at the equations for Cpu and Ppu. What differences do you see? Now look at equations for Cpl and Ppl. What differences do you see?
The only difference is that Cpu and Cpl both use s – the estimated standard deviation from a range control chart, while Ppu and Ppl both use s – the calculated standard deviation from all the data.
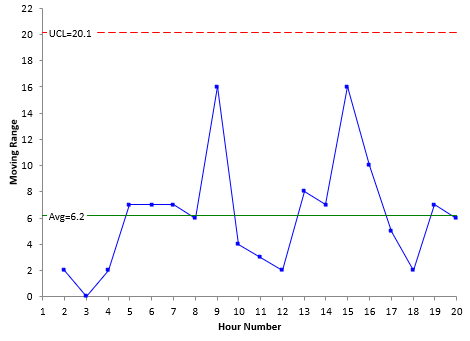
What does the difference mean? The easiest way to see this is through an example using an individuals control chart (X-mR). With an individuals control chart, the individual (X) value is plotted on the X chart. The range between consecutive points is plotted on the moving range (mR) chart. The average moving range is used to calculate the value of s. And this value is used in the Cpk calculations.
Suppose the data are being collected hourly. Each moving range represents the “short-term” variation – the variation between consecutive hours. Cpk is sometimes referred to as the short-term capability – it represents what the process is capable of doing in the short-term – from hour to hour in this example.
| Hour | X | Hour | X |
|---|---|---|---|
| 1 | 106 | 11 | 102 |
| 2 | 104 | 12 | 100 |
| 3 | 104 | 13 | 92 |
| 4 | 106 | 14 | 99 |
| 5 | 99 | 15 | 115 |
| 6 | 92 | 16 | 105 |
| 7 | 99 | 17 | 100 |
| 8 | 93 | 18 | 98 |
| 9 | 109 | 19 | 105 |
| 10 | 105 | 20 | 99 |
The figure below represents the moving range for the data given. The first X value is 106; the second X value is 104. So, the moving range between these two results is 2.
The average moving range for these data is 6.2. For a moving range between consecutive points, ? is calculated as the following:
s = R/1.128 = 6.2/1.128= 5.50
This is the value that would be used in calculating Cpk.
For Ppk, the standard deviation of all the X values is calculated. Note that all the values are used at one time to determine the standard deviation. These values represent 20 hours (since there are 20 data points). This is a much longer time-frame than the between consecutive hours in the moving range chart. Because of this, Ppk is sometimes referred to as the long-term capability. In Excel, you can use the function STDEV to calculate the standard deviation. The result is:
s = 5.7
This is the value that would be used in calculating Ppk
The difference between Cpk and Ppk is simply in how you calculated the standard deviation. So, which is better to use: the short-term Cpk capability or the long-term Ppk capability? This will be the topic of our next blog.
Our SPC Knowledge Base has multiple publications on process capability if you would like more details.
The control chart above was made using SPC for Excel, a simple but powerful software for statistical analysis in the Excel environment.
