MSA/Gage R&R Options in SPC for Excel
Home » MSA/Gage R&R Options in SPC for Excel
There are numerous features and options in the Measurement Systems Analysis/Gage R&R techniques in SPC for Excel to help you determine how “good” your measurement system is. The ten techniques included in the software are:
- EMP Studies: Consistency Study, Short EMP study, Basic EMP Study
- Gage R&R studies: ANOVA Gage R&R, Average/Range Method, Nested Gage R&R, Type 1 Gage Study and Attribute Gage R&R
- Equivalency of Instruments
- Linearity and Bias Study
- Bland-Altman Plot
- Deming Regression
See how easy it is to use the software from an example of ANOVA Gage R&R in the video below.
See how to setup the data entry and how to run the analysis to generate a detailed or summary report that includes the ANOVA tables, the operator-part charts, the components of variance chart as well as charts for operator bias and repeatability. To see the detailed reports with an explanation of each section in the report, select the link(s) below.
EMP Studies
There are three EMP studies included in the software:
- Consistency Study: one operator measuring one part multiple times with the primary purpose of determining the measurement system error
- Short EMP Study: one operator measuring multiple parts multiple times with the primary purpose of determining the measurement system error and how it compares to the total variation in the process
- Basic EMP Study: multiple operators measuring multiple parts multiple times with the primary purpose of determine the repeatability and reproducibility of the measurement system
There are options to allow you to gain many more insights into the measurement system from the EMP studies. These include adding a historical standard deviation and specifications. The output can contain the following items:
- Control Charts
- Control chart analysis
- Bias analysis against a standard
- Check to determine if data are chunky
- Degrees of freedom check to ensure there is enough data
- Main effects chart for operator bias
- Mean range chart for operator repeatability
- Calculate test-retest error
- Calculate probable error
- Determine if measurement increment is adequate
- Calculate watershed specifications
- Calculate precision to tolerance ratio
- Calculate overall and product variances
- Calculate Interclass Correlation Coefficient
- Determine the Type of Class Monitor
- Option for detailed report (with or without data table) or summary report
ANOVA Method for Crossed Gage R&R Designs
Designed for multiple operators measuring multiple parts multiple times with the primary purpose of determine the repeatability and reproducibility of the measurement system; output includes:
- ANOVA table with interaction
- ANOVA table without interaction
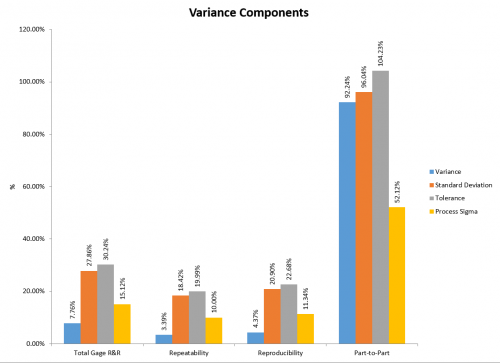
- % contribution based on variance, standard deviation, tolerance or process standard deviation
- Number of distinct categories
- Variance components chart
- Operator-parts control charts
- ANOM charts for bias and repeatability
- Option to change sigma multiplier
- Option to change p value to remove interaction
- Options to include the following charts:
- Run chart by part
- Run chart by operator
- Scatter plots
- Whiskers charts
- X-Y plots
- Option for detailed report (with or without data table) or summary report
Average/Range Method for Crossed Gage R&R Designs
Designed for multiple operators measuring multiple parts multiple times with the primary purpose of determine the repeatability and reproducibility of the measurement system; output includes:
- % contribution based on variance, standard deviation, tolerance or process standard deviation
- Number of distinct categories
- Variance components chart
- Operator-parts control charts
- ANOM charts for bias and repeatability
- Options to include the following charts:
- Run chart by part
- Run chart by operator
- Scatter plots
- Error charts
- Whiskers charts
- X-Y plots
- Option for detailed report (with or without data table) or summary report
ANOVA Method for Nested Gage R&R Designs
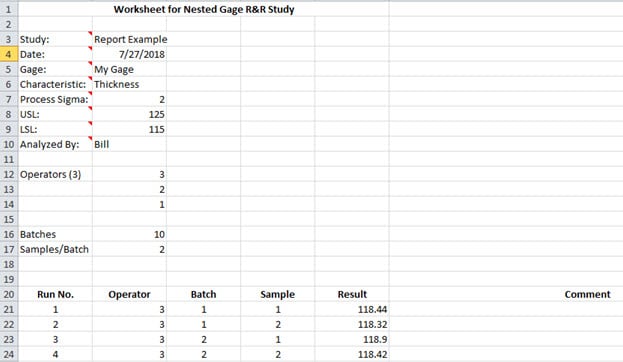
Designed for multiple operators measuring multiple parts multiple times with the primary purpose of determine the repeatability and reproducibility of the measurement system; output includes:
- ANOVA table
- % contribution based on variance, standard deviation, tolerance or process standard deviation
- Number of distinct categories
- Variance components chart
- Operator-parts control charts
- ANOM charts for bias and repeatability
- Option to change sigma multiplier
- Options to include the following charts:
- Run chart by batch(operator)
- Run chart by operator
- Option for detailed report (with or without data table) or summary report
Type 1 Study Method
Designed for a calibrated reference part that is measured many times within a short period of time to determine the bias and repeatability of a measurement system; output includes:
- Measurement statistics
- Run chart of measurement variation vs tolerance range
- Bias
- Capability Assessment
- Option for data table in report
Attribute Gage R&R Method
Designed for multiple operators measuring multiple parts multiple times with the primary purpose of determine how good a measurement system is for yes/no attribute data; output includes:
- Effectiveness table (attribute Gage R&R report)
- Cross-tabulations
- Kappa values
Equivalency of Instruments
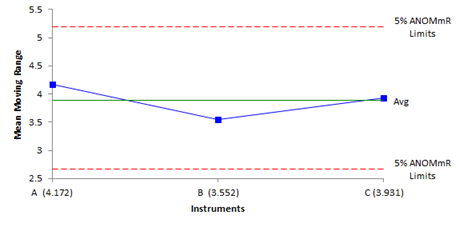
Designed to compare the bias and repeatability of multiple instruments; output includes:
- X-mR charts for each instrument to check consistency
- Mean moving range chart to check for differences in measurement error
- ANOM chart to check for bias
- Bias calculations to recenter the limits
- ANOM chart with limits recentered
- Bias calculations with known standard
- ANOM chart for instrument bias with known standard
- Option to change alpha for the ANOM critical values
Linearity and Bias Study

Designed to determine if a measurement system is linearly across a range of values and if bias exists in the measurement system; output includes:
- Linearity Chart
- Linearity Results
- Bias Results
- Option to add data table in report
Bland-Altman
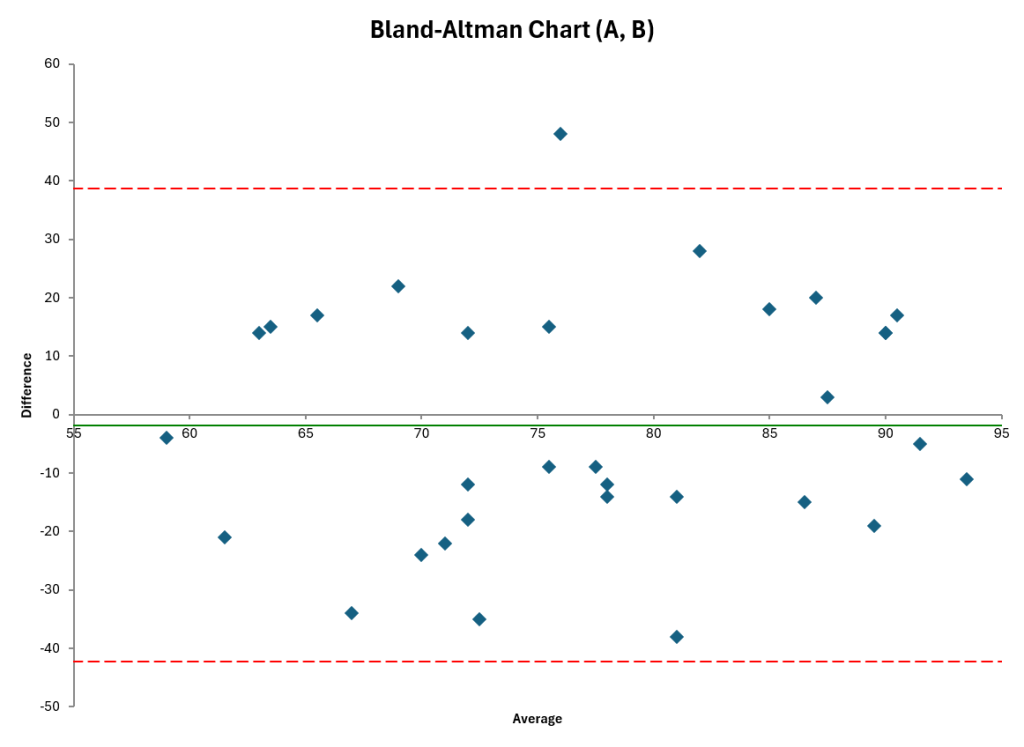
It is one chart that allows you see the average difference between the two measurement systems and the amount of variation in the differences. The output is the Bland-Altman chart which contains the:
- Difference in a paired sample versus the average of the paired sample
- Average Difference
- Limits of Agreement
Deming Regression
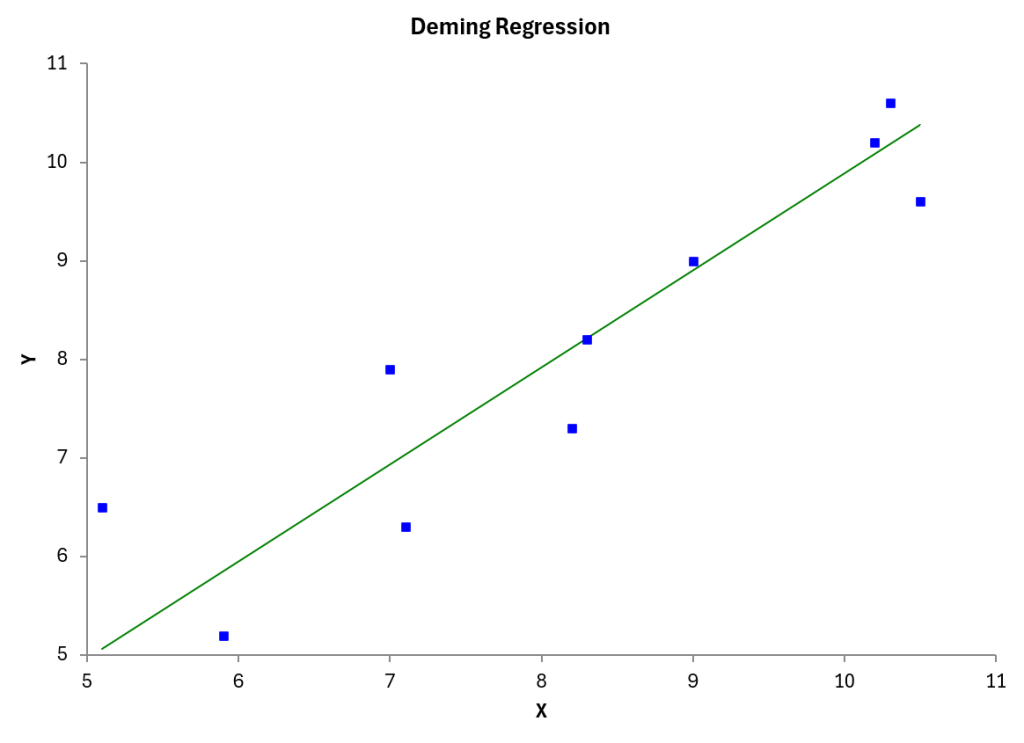
Designed to compare two measurement systems taking into account the measurement error of each tests. The output includes:
- Regression plot with best fit equation
- Normal probability plot
- Regression table: coefficients, standard error, degrees of freedom, t statistic, p-value and confidence limits
- Descriptive statistics for both tests: sample size, mean, error standard deviation, error variance, error COV
- Hypothesis testing for slope and mean: parameter, standard error, degrees of freedom, t statistic, p-value, and confidence limits
- Residuals and standardized residuals
- Residuals charts: vs predicted, vs order, vs X, vs Y and histogram