February 2004
In this issue:
Greetings,
Welcome to the SPC for Excel e-zine. Each month you will receive information on a featured SPC topic and other items. We hope you enjoy this issue. Please let us know your ideas for topics to cover as well as any ideas you might have for improving the e-zine.
The focus for this month is leadership and variation. Leaders often think of variation only in terms of control charts to be used by people lower in the organization. They don’t think about how to apply variation to their own processes, in particular, the financial results of the company. Getting leadership to understand variation and how it applies to their processes is a difficult task, but one with great potential payback.
Leadership and Variation

Yet leaders look at lots of data. Important measures to them typically fall into three categories: financial, operational and personnel. The financial measures are the ones that get the most focus. Typical financial measurements include sales revenues, gross profit, SG&A as % of sales and days sales outstanding. Operational measures include freight, on-time delivery, and turns. Personnel measurements include turnover, training hours, and absenteeism.
Why do leaders take these measurements and examine them? The same reason people lower in the organization use control charts: to know how they are performing (staying the same, improving, declining), to know how they are performing versus a standard, target or goal, and to know how they performed historically.
But how do leaders examine their data? For example, suppose sales in January 2004 were $1,122,905. What’s in this number? A number by itself has little meaning. So, we naturally want to compare it to something. But to what? You can compare the number to the budget for January ($950,000). Things look good versus the budget. And you can compare it to January of the previous year ($799,674). Things look very good compared to last year.
Typical comparisons made by leadership are usually in the form of a monthly profit and loss statement and include:
- This month’s result to last year’s result
- This month’s result to budget
- Year-to-date (YTD) result to last year-to-date (LYTD)
- YTD result to budget
These types of comparison are limited in their ability to detect what the process is really doing. For example, suppose you have the information below for the first six months of 2004. What would you say about sales?
| Monthly Report | |
|---|---|
| YTD | $5,710,777 |
| Budget | $5,700,000 |
| Budget Variance | $10,777 |
| LYTD | $5,364,826 |
| LYTD Variance | $345.951 |
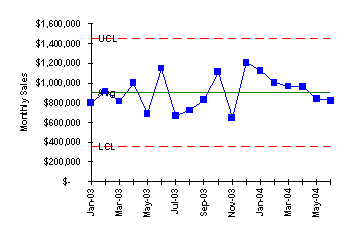
Based on these results, it looks like everything is great. Sales are pretty much on budget and way ahead of last year’s result. But this common approach does not look at the underlying process. The only tool to effectively do that is a time series or control chart. Consider the data shown below. It was used to create the “report” above. What does this data show you?
| Month | Sales |
|---|---|
| Jan-03 | $799,674 |
| Feb-03 | $913,199 |
| Mar-03 | $813,271 |
| Apr-03 | $1,000,470 |
| May-03 | $689,679 |
| Jun-03 | $1,148,533 |
| Jul-03 | $669,352 |
| Aug-03 | $721,466 |
| Sep-03 | $827,840 |
| Oct-03 | $1,111,742 |
| Nov-03 | $648,125 |
| Dec-03 | $1,205,467 |
| Jan-04 | $1,122,905 |
| Feb-04 | $1,001,558 |
| Mar-04 | $965,345 |
| Apr-04 | $961,690 |
| May-04 | $840,273 |
| Jun-04 | $819,007 |
While looking at the table of numbers is an improvement, it does not tell the full story. The only way to do that is through a control chart. The control chart for sales (see the control chart at the start of this article) shows that the sales process is not in control. The last seven months, sales have been decreasing/ slowing each month. The downward trend is an out-of-control situation that is hidden by the financial reports. This is not good. And, if you only look at financial reports, you will not see the trend for some time.
Leadership must understand the concept of variation and be able to apply it to their own processes. Using control charts to monitor the financial results of a company gives leaders insight into what is happening in the process. The charts will show if the financial process is in control or if it is trending up or down. Once the process is in control, you can use the results to predict the future. Some companies have done away with their cumbersome budgeting process and now use control charts and the past history to develop the next year’s budget.
With Whom Does Quality Begin?
We are all responsible for the quality of our work. However, as you learned from the last e-zine, the vast majority of problems we are faced with are due to the way we put the process together and manage it on a day-to-day basis. Our challenge is how to make our processes as mistake-proof as possible. No one makes mistakes on purpose. Remember, it is usually the process, not the people.
For example, suppose your job is counting f’s in sentences. You are responsible for counting the correct number. How many f’s are in the sentence below?
“Finished files are the result of years of scientific study combined with the experience of years.”
How many did you find? 3, 4, 5, maybe 6. We will explore this in more detail in next month’s e-zine that will focus on operational definitions.
Remember, each of us is responsible for the quality of our work. Our challenge is to develop and implement processes that generate the results we want each and every time.