In this issue:
- Variation: Spilling the Milk
- A Case Study in Variation
- Separating Common from Special Causes of Variation
- Quick Links
Greetings,
Welcome to the inaugural edition of the SPC for Excel e-zine. Each month you will receive information on a featured SPC topic and other items. We hope you enjoy this issue. Please let us know your ideas for topics to cover as well as any ideas you might have for improving the e-zine.
We will begin this issue where everyone needs to begin whenever you are implementing SPC – with variation. To effectively use SPC, you must understand the concept of variation – and in particular, the difference between common and special causes of variation.
Variation: Spilling the Milk
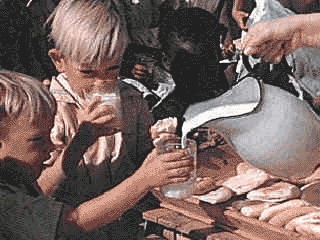
 I used to, now and then, spill a glass of milk when I was young. Our table slanted toward where my mother sat. So, the milk always headed in her direction. And she usually had some choice words when this happened. Of course, I was at fault. I needed to be more careful. Or was that really true? If you understand variation, you will realize that most of the problems you face are not due to individual people, but to the process — the way it was designed and the way it is managed on a day-to-day basis.
Variation comes from two sources, common and special causes. Think about how long it takes you to get to work in the morning. Maybe it takes you 30 minutes on average. Some days it may take a little longer, some days a little shorter. But as long as you are within a certain range, you are not concerned. The range may be from 25 to 35 minutes. This variation represents common cause variation — it is the variation that is always present in the process. And this type of variation is consistent and predictable. You don’t know how long it will take to get to work tomorrow, but you know that it will be between 25 and 35 minutes as long as the process remains the same.
Now, suppose you have a flat tire when driving to work. How long will it take you to get to work? Definitely longer than the 25 to 35 minutes in your “normal” variation. Maybe it takes you an hour longer. This is a special cause of variation. Something happened that was not supposed to happen. It is not part of the normal process. Special causes are not predictable and are sporadic in nature.
Why is it important to know the type of variation present in your process? Because the action you take to improve your process depends on the type of variation present. If special causes are present, you must find the cause of the problem and then eliminate it from ever coming back, if possible. This is usually the responsibility of the person closest to the process. If only common causes are present, you must FUNDAMENTALLY change the process. The key word is fundamentally — a major change in the process is required to reduce common causes of variation. And management is responsible for changing the process.
It has been estimated that 85 to 94% of the problems a company faces are due to common causes. Only 6 to 15% are due to special causes (that may or may not be people related). So, if you always blame problems on people, you will be wrong at least 85% of the time. It is the process most of the time that needs to be changed. Management must set up the system to allow the processes to be changed.
So, Mom, sorry. But most of the time, spilling the milk was not my fault. It was usually yours (management). The glasses were too big for my small hands (no spill-proof cups in those days). When I wanted to put it by the edge of the table to make it easier to reach, you said move it back – I might spill it. And with the meal-time conversation, how could I concentrate on my milk!
So, first teach the concept of variation. Then the use of control charts (see Separating Common from Special Causes below) will make more sense to people
A Case Study in Variation
 To really understand variation, many people have to change their paradigm. The following is a true story. A plant produced a number of different powdered products. Each of these products was run through the same production equipment at different conditions and put into unique silos (one or more for each product type).
To ensure that the product went to the correct silo, an operator had to set up the lines from the process to the correct silo. If product was introduced into the wrong silo, the entire silo had to be sold as off- grade, at a tremendous reduction in price. The cost was typically $30,000 per incident.
The plant leadership had a policy that anyone who cross-contaminated a silo received three days off with no pay. What type of variation did leadership assume was present? Special cause. They assumed that the operators were at fault. One manager said that he was not going to “idiot proof” the plant.
Was leadership correct? The only way to find out is to collect data.
It turns out that anyone who had worked in the unit for more than 3 months had time off for cross- contaminating a silo. If everyone is doing it, what type of variation is it? Common cause. And the only way to reduce common cause of variation is to change the process.
Leadership put together a team that worked on the problem. The team came up with two simple solutions: label the lines and put better lights out at night. Easy solutions but beyond the authority of the operators to get done by themselves. With the solutions implemented, the problem, which had been occurring almost monthly, went away entirely. So simple if you understand variation.
Separating Common from Special Causes of Variation
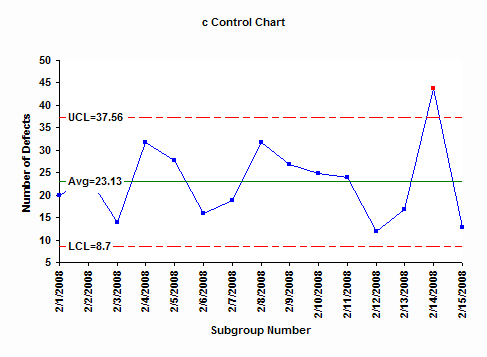
Contr ol charts are the only reliable way to separate common from special causes of variation. In a control chart, the points are plotted over time. An average line is calculated along with an upper control limit and a lower control limit. Some charts do not have a lower control limit.
The upper control limit is the largest value you would expect if there is just common cause of variation present in the process. The lower control limit is the smallest value you would expect. The limits are determined by mathematical equations. They vary, depending upon the type of control chart and sampling process used..
A process is in “statistical control” if it has only common cause of variation present. This is determined by examining the control chart. As long as the chart has no points above or below the control limits and no patterns (such as seven points in a row above or below the average), the process is said to be in statistical control.
You can predict what will happen with a process that is control. Future production will continue between the two limits as long as the process remains the same.
To effectively use control charts, you must be able to interpret the control chart. Ask: What is this chart trying to tell me about my process? A control chart is the way a process communicates with you. It will tell you if the process is operating as designed (in control) or if there is a problem (special cause). All you have to do is “listen.”
And best wishes for 2004!