September 2011
 “But, you can’t measure what I do!” Have you heard that one before? Most likely you have if you are involved in process improvement, in using SPC, or getting people to take data and track it over time. Or maybe you heard one of these:
- “We don’t do the same thing over and over. So, there is really nothing we can measure.”
- “Everything that happens to us is really beyond our control.”
- “We don’t have the time and resources to do this.”
- “There is really nothing we can work on.”
What excuses have you heard? In most cases, these answers do have some truth in them – particularly from the viewpoint of the person who said it. So, how do you handle these situations? How do you get these people involved in process improvement efforts? Well, it is not easy! It actually takes a blend of process and people skills. So, what can you do? How can you point out potential metrics to track? Is there anything that everyone can measure? We try to answer these questions in this month’s newsletter.
In this issue:
You may leave a comment at the end of this newsletter if you are so inclined. We start with the process – as you should always do.
It’s the Process
The rock on which statistical process control (SPC) is built is the concept of variation. This was one of the four bodies of profound knowledge that Dr. W. Edwards Deming taught us. We have a four part series in our newsletter section on Dr. Deming. Everything varies – and most of our problems are caused by common causes of variation. And these are due to the process – the way it was designed and is managed on a day-to-day process. It is the process. So, the first place to start with someone is with his/her process.
Remember, a process is simply what we do. It can be filling out an expense report, checking a person into a hospital, burning a CD with music, driving to work, filling a prescription, etc. All these processes generate an output – either a product or service. But, in addition, the processes generate data. SPC is simply taking that data the process generates and using it to control and improve the process.
Suppose Joe doesn’t think there isn’t anything he does that is repetitive or that is repeatable enough for him to take data. He is in charge of a job shop. Each job is different. There are different specifications, different customers, different equipment requirements, and different deadlines for each job. You may or may not agree with Joe, but let him have his stance. There are ways to handle small jobs like this, but don’t go there now. Start by talking to Joe about what he does and what his processes are. Your objective is to gain a basic understanding of what he does and, most importantly, the issues and problems he faces on a day-to-day basis. Help him solve his problems and you are pure gold to him.
Ask him directly: what are your biggest problems? He will have an answer and you will have your process to work on improving. In fact, he will have lots of answers – all his problems that make his job so hard. Pick one of those processes. Suppose he lets you know that his biggest headache is the time to setup a certain CNC machine. Now you have your process.
The next step is to draw a process flow diagram for setting up the CNC machine. The steps in putting together a process flow diagram are shown in the figure below.
Figure 1: Steps in Making a Process Flow Diagram
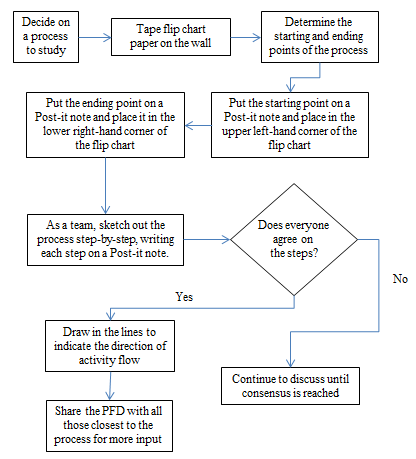
First you decide on the process – in this case, setting up the CNC machine. Process flow diagrams are best made by those closest to the process. So, in addition to Joe, include the people who actually setup the machine. Tape a piece of flip chart paper to the wall. Then decide on the starting and ending steps in the process. This is very important. It defines the boundaries for the process. For example:
- Step 1: Order is received at CNC machine from lead operator
- Last Step: First piece is within specifications
Note in this case, the setup is not complete unless the first piece is within specifications. Use Post-it notes to make your process flow diagram. This allows you to move the steps around in case you forgot a step. You really only need two shapes for a process flow diagram. The rectangle is used for all steps except a decision where a diagonal is used. Once everyone agrees on the process, draw in the lines to indicate the direction of activity.
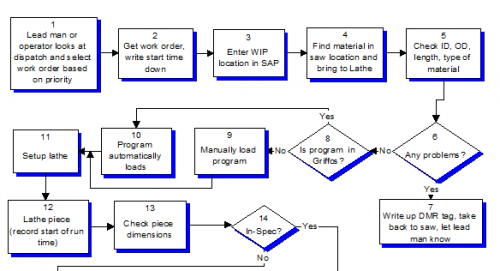
Now you are ready to determine where you can measure the process to provide feedback. Almost all process flow diagrams will have at least one decision box. These represent potential places to measure the process. A partial process flow diagram is shown below. There are three decision boxes – each of these represents a place where measurements can occur. For example in step 14, you could measure the % of pieces in specification using a p control chart or an individuals control chart as well track reasons that pieces are out of specification using a Pareto diagram.
Figure 2: Process Flow Diagram Example One
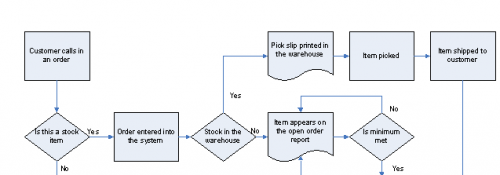
Another example is shown below. Again there are several decision boxes – each representing a potential point to collect data including the % of items in stock and % of orders meeting minimum. The presence of a decision box does not mean that you should take data there – just that the opportunity exists to do so. Also, there may be other places in the process where data can be collected.
Figure 3: Process Flow Diagram Example Two
The process flow diagram helps you decide where to collect data within the process. It is often helpful to collect data on the performance of the entire process. You can collect data on the entire process in one or more of these four dimensions:
- Quantity
- Quality
- Timeliness
- Cost
Returning to Joe – his main concern was the time to setup the machine. So, one obvious measure is the time in minutes from the first step to the last step. Measure each setup and plot the results on an individuals control chart. Overtime, you will see the variation in the setup times as well as identify any special causes that are present. From here, you are ready to start to work on reducing that setup time.
So, what do you do if you can’t get buy-in on a process? Well, there are some universal metrics that impact us all.
Yes, There Are Some Universal Metrics
Yes, pure and simple. Everyone has a few metrics they can track and work on improving. The first one that comes to mind: rework. We all have it and we all do it. I am not talking about the traditional definition of rework – having to rework the product because it is out of specification or redo the service work because it was not done right the first time. I am talking about rework related to you and your time.
Rework is simply defined as having to do something over because it wasn’t done right the first time. It doesn’t matter if you or someone or something else caused the rework. Simple definition, but is it? If you proofread a letter you wrote, is that rework? You wouldn’t be doing it if you did it right the first time. How much time do you spend on rework? Imagine if everyone in the organization could reduce their own rework in half. Wow! What would you do with all your extra time?
Silly you say. How much time can people possibly spend doing rework? 20%? 40%? You will probably be surprised. I know I was the first time I went through this with my department. In a previous time, I ran the Quality Development group for a chemical company. We tracked how much time we spent in rework. Over 30% of our time was spent on rework. Talk about opportunities for improvement!
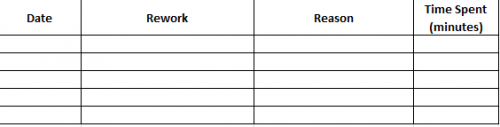
How do you track rework? It is fairly simply. All you need is a simple data collection sheet. Excel works great for this. It can be as simple as the one below. The first column is the date of the rework. The second column is what was reworked while the third column is the reason for the rework (cause if known). The last column is the minutes spent in rework.
Figure 4: Rework Data Collection Sheet
There were five of us in the department. Each week, we plotted the total time spent on rework as an individuals control chart. Plus, we constructed a Pareto diagram on the reasons for rework. The Pareto diagram was updated each week with the new data. And we began to work on the largest reasons for rework.
Another “universal” measurement is “things that get in the way of doing a quality job.” Now this is not data that are very good for a control chart, but it is great data for determining what prevents you from doing a better job and you can use a Pareto diagram. For example, you can’t get a report done on time because the data you need from another department is not accurate. This gets in the way of doing a quality job. Some of these things may well lead to rework.
Two simple things to track and improve: rework and things that get in the way of you doing a quality job. So simple.
Summary
In this newsletter, we looked at some ways to help people see what can be measured. The best place to start is with a process flow diagram. The process flow diagram lays out the steps in the process and makes it much easier to see where the process can be measured. You can always take measurements at the decision diamonds. You should also measure the entire process in the dimensions of quantity, quality, timeliness and cost. Finally, there are at least two things we can always measure – our rework and the things that get in the way of us doing a quality job.
Nice and practical advice, Bill. It surprises me still how many of my clients don’t see their work as processes. But it’s so revelational, and such a wonderful way to find meaningful performance measures. Your article is an easy read and the example you give shows how important it is to respect people’s views and to seek first to understand, not to change them! I hope you don’t mind my sharing this with my own subscribers? Smiles, Stacey Barr. http://www.staceybarr.com
Thanks Stacey. Don't mind you sharing with your subscribers at all!
Bill
Excellent! You know my team very well.
It is always an uphill battle to get them to admit that improvement opportunities exist everywhere and in every process.
Convincing everyone that useful data is waiting for us in every process to collect and use is another tiring task.
This article helps me tremendously by assuiring me that "I am not alone" and that it really can be done.
Thank you very much.
Rab Naipaul
Bill,
Great timing on the topic. Three times today I had a similar discussion with fellow Associates about some element of our procees responsibilities. Also, liked the reminder about what gets in the way of serving the customer/doing Quality Work.
Really appreciate the monthly newsletter to keep me focused on the process.
Thanks,
Walt Wilson