June 2022
(Note: all the previous SPC Knowledge Base in the process improvement category are listed on the right-hand side. Select this link for information on the SPC for Excel software.)

This publication explores this question in more detail. The answer is relatively simple – you start where you have the most opportunity. Data are important in determining where you have that opportunity. And, of course, your knowledge of the production process and measurement process is key. But you have to be prepared to begin. This does not happen overnight. The big reality is that, if you have to reduce your process variation, and you don’t know where to start, you are too late to the game. You monitor your process over time – but that is not enough.
Monitoring your measurement process over the long term is vital to knowing where to start for process improvement.
In this issue:
- What is in a Repeated Measurement
- Relationship between Total, Product and Measurement Variation
- Estimating the Variances
- Where to Start
- Summary
- Quick Links
We start by taking a look at measurements and what a measured value represents.
Please feel free to leave a comment at the end of this publication. You can also download a pdf copy of this publication at this link.
What is in a Repeated Measurement?
We take measurements to monitor our processes. What is in a repeated measurement? You can look at a repeated measurement as being composed of two parts:
Repeated Measurement = Product Value + Measurement Error
What does this simple model imply? If the measurement error is zero, repeated measurements will produce the same value. So, if one sample/part is taken from a process and repeated measurements made, the same measured value will be obtained when there is no measurement error. Now, what happens to the repeated measured values as measurement error increases? Obviously, the repeated measured values will not be the same. The larger the measurement error becomes, the more variation there is in the repeated measured values. The measurement error can become so large, the measured value reflects just the variation in the measurement process and not the product value.
Relationship between Total, Product and Measurement Variation
Of course, you don’t want to just measure one sample over time. You want to take samples from a process in an ongoing fashion. So, you follow a process like the following. You take a sample from your process. You test that sample using your measurement process. You get a result (X1). You take another sample and test that sample. You get another result (X2). Usually, X1 does not equal X2. This continues over time. What are in these results? Two major components are present in each result: the variation in the product itself and the variation in the measurement process.
The basic equation describing the relationship between the total variance, the product variance and the measurement process variance is given below.
σx2= σp2+σe2
where σx2= total variance of the product measurements, σp2= the variance of the product, and σe2= the variance of the measurement process.
Dr. Donald Wheeler has written extensively about measurement processes and how to determine how useful they are. His book EMP III: Evaluating the Measurement Process & Using Imperfect Data (available from www.spcpress.com) is a must read for anyone interested in understanding the impact measurement processes have on the results. You can also access our 32 articles on Measurement Systems Analysis in our SPC Knowledge Base. Dr. Wheeler uses the Intraclass Correlation Coefficient to define the relative utility of a measurement process. The Intraclass Correlation Coefficient is simply the ratio of the product variance to the total variance and is denoted by ρ:
ρ=σp2/σx2
This is simply the % of the total variance that is due to product variance. Remembering the basic equation above, then:
% of the total variance that is due to the measurement process = 1 –ρ
The product variance is not easy to estimate so the value of ρ is usually rewritten to be:
ρ=σp2/σx2=(σx2-σe2)/(σx2)=1-σe2/σx2
To find the value of ρ, we need to estimate the total variance and the measurement process variance.
Estimating the Variances
Before you decide to work on the production process or the measurement process first, you do need to know how much of the variance is due to the measurement process and how much to the product.
The best way to estimate the variance of the measurement process is to run a standard/control on a regular basis and use an individuals control chart to monitor the results. A standard is something that you know the true value of. If you don’t have a standard for a process, then you can set aside a large portion of material to use as a control.
There are ways to get a snapshot in time of the measurement process variation, but nothing matches running a control/standard over time. This allows, over time, all the sources of variation that can affect a measurement process to come into play – things like lab temperature, lab humidity and different operators. Note that this is different than one person running the same thing over and over in a row – which is one way to estimate the measurement error. With running a control over time, you are intentionally allowing the other sources of measurement process variation to enter the calculations. The measurement error you get from this approach will probably be larger than one when one person measures the same thing multiple times in a row.
Suppose you have set aside a control that you will use to monitor a test of the color of a powder. You don’t have a standard to use for the color. You run the control daily. The results for the last 50 days are shown below in Table 1.
Table 1: Color Results for Control Powder
| Control Number | Result | Control Number | Result | Control Number | Result | ||
|---|---|---|---|---|---|---|---|
| 1 | 110.3 | 18 | 98.7 | 35 | 110.9 | ||
| 2 | 94.8 | 19 | 81.5 | 36 | 108.2 | ||
| 3 | 91.7 | 20 | 94.2 | 37 | 99.1 | ||
| 4 | 107.4 | 21 | 93.8 | 38 | 105.9 | ||
| 5 | 108.6 | 22 | 101.9 | 39 | 92.0 | ||
| 6 | 98.3 | 23 | 103.8 | 40 | 92.1 | ||
| 7 | 109.1 | 24 | 105.3 | 41 | 106.3 | ||
| 8 | 114.2 | 25 | 101.0 | 42 | 112.9 | ||
| 9 | 85.9 | 26 | 79.7 | 43 | 89.3 | ||
| 10 | 111.5 | 27 | 95.1 | 44 | 104.8 | ||
| 11 | 99.6 | 28 | 90.5 | 45 | 84.6 | ||
| 12 | 104.1 | 29 | 111.0 | 46 | 104.2 | ||
| 13 | 104.4 | 30 | 100.4 | 47 | 88.5 | ||
| 14 | 103.5 | 31 | 101.6 | 48 | 99.2 | ||
| 15 | 106.2 | 32 | 117.2 | 49 | 118.5 | ||
| 16 | 90.8 | 33 | 100.1 | 50 | 99.3 | ||
| 17 | 95.0 | 34 | 102.4 |
Note the data in Table 1 represents the data for the last 50 days. It is not simply having someone perform a Gage R&R study or consistency study in one day. The data in Table 1 represents a much longer time period. There are more sources of variation in the measurement process, e.g., different operators. But the data, over time, gives a truer picture of the real measurement process variation.
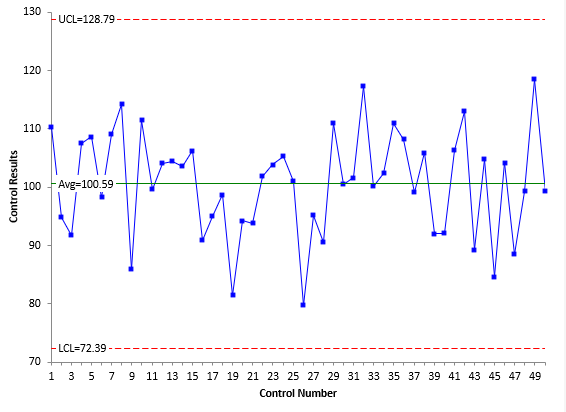
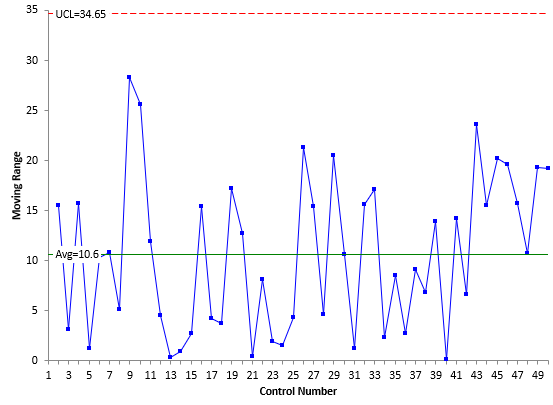
The data in Table 1 were used to construct an individuals (X-mR) control chart. The X chart is shown in Figure 1, and the moving range chart is shown in Figure 2. For more information on how to construct an X-mR chart, please see our SPC Knowledge Base publication Individuals Control Charts.
Figure 1: X Chart for Control Samples
Figure 2: Moving Range Chart for Control Samples
Both charts are in statistical control. This means that the measurement process is consistent and predictable. For more information on interpreting control charts, please see our SPC Knowledge Base article Interpreting Control Charts.
As you monitor the measurement process over time, if an out of control point occurs, you should treat the measurement process as being mechanically broken and can’t be used again until fixed. It can only be used once the special cause of variation has been found and removed from the measurement process.
You can estimate the measurement process variance using the following equations:
σe=R/1.128 = 10.6/1.128 = 9.40
σe2= 9.402= 88.36
where σe is the measurement process sigma, R is the average moving range from Figure 2, and σe2 is the measurement process variance. The value of 1.128 is a control chart constant that is used when a moving range of 2 is used on the moving range chart.
Now, to find the % of total variance due to the measurement process, we need a measure of the total variance. The best way to find the total variance is to use historical data. The time frame for the historical data should be long enough so that all the potential sources of variation have an opportunity to enter the process. Use the historical data to make a control chart. You can use the individuals control chart again. Note that you really don’t need the X chart at all. You don’t care if the X chart is in control. You are looking for an estimate of total variance. That comes from the average moving range – just as with the measurement process above.
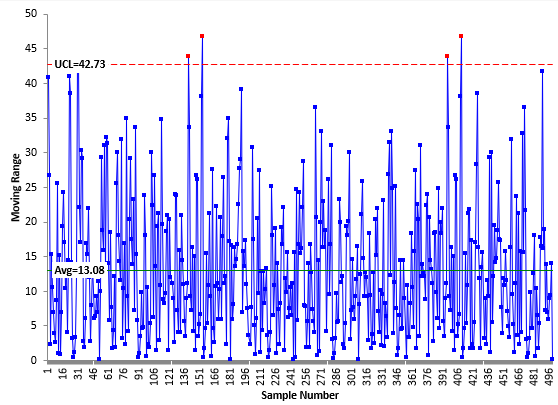
Suppose you have 500 historical data points. This is too many points to show in a table here, but you can download a workbook with the data used in this publication at this link. The moving range chart based on these data is shown in Figure 3.
Figure 3: Moving Range Chart for Historical Data
What about out of control points on this chart? Should you worry about them? Not really if there are only a few of them. There are four points here beyond the upper control limit. So 4 out of 499 moving ranges are out of control. I would not worry about those at all. All you want here is a good estimate of the average moving range. You will get that with this many data points and so few out of control points.
You can now use the average moving range to determine the total variance.
σx=R/1.128 = 13.08/1.128 = 11.60
σx2= 11.602= 134.56
You can now determine the % of total variance due to the measurement process:
% of Total Variance Due to the Measurement Process = 100 (σe2/σx2) = 100(88.36/134.56) = 65.7%
By default, then:
% of Total Variance Due to the Product = 100(1 – σe2/x2) = 34.3%
Where to Start?
So, where do you start? The reality is that reducing the product variation or the measurement process variation will both reduce the overall variation in the process. Far too often, the measurement process variation is not considered when looking at improving the overall process. The emphasis almost immediately is to look at the product variation.
If it is important enough to spend time reducing the variation in your process, you need, at a minimum, to know where the variation is located – where the opportunity lies.
For example, if the % variance due to the measurement process is 10% and the % due to the product is 90%, it does not make sense to spend any time on the measurement process. If the opposite occurs and the measurement process is responsible for 90% of the variance, it does not make much sense to work on the product variance.
When the % variance due to the product and % variance due to the measurement process are similar, there may well be opportunities in both areas. And there is nothing written that you can’t work on both at the same time. Your process knowledge will help determine where to start on reducing the total variance.
But you should be prepared. You can start with answering these two questions:
- Does the laboratory run a control/standard on regular basis for each of its critical tests?
- Does the laboratory know the % of variance that is due to the measurement process for each of its critical tests?
If the answer to either of these questions is no, then you know where to start to get ready to reduce variation in a process. You need to address those two questions.
The steps in running a control/standard on a regular basis are straightforward:
Run a control/standard on a regular basis. A standard is something you can repeatably measure over time and has known value. If you don’t have a standard, a control is a large amount of material that you have set aside to be tested regularly. The control must be homogeneous throughout.
- Plot the results using an individuals (X-mR) control chart. The individual result is plotted on the X chart. The moving range between consecutive points is plotted on the moving range (mR) chart.
- Bring the measurement process into control by finding and eliminating special causes. Being in statistical control is not the natural state. It takes work to bring a measurement process into statistical control.
- Determine the accuracy of the measurement process by comparing the center line on the individuals (X) chart to the “true value” of the standard. If you don’t have a standard, assume that the “true value” is the center line on the X char for the control.
- Determine the precision of the test method by calculating sigma for the measurement process from the moving range chart using sigma = average moving range/1.128.
- Determine the percent of total variance due to the measurement process by comparing the measurement process variance to the total variance. You can use historical data as shown above.
- Continue to monitor the accuracy and precision of the measurement process over time. This is critical to do. It helps ensure that your measurement process is consistent over time. It allows all potential sources of variation to enter into the measurement process.
For more details on monitoring the measurement process by using control charts please see our SPC Knowledge Base article Monitoring Test Methods Using SPC.
To be prepared for where to start to reduce variation, you should have a table that lists the critical measurement processes and the % of the total variance each is responsible for.
Summary
This publication examined the situation where you must reduce process variation and how you decide where to start – the product or the measurement? In reality, if you wait this long, you are not in good shape. To be most useful, the measurement process variation calculations should cover a long period of time. This happens by running a standard/control over time and monitoring the measurement process using a control chart. Once stable, you can estimate the measurement process variance. You can then look at historical data to estimate the total variance. This gives you a measure of the % of variance due to the measurement process and gives you insights on where to begin your variation reduction efforts.


