September 2023
 Rational subgrouping. Do you recognize this term? If not, you are missing a key ingredient in effectively using control charts. If you do recognize it, when was the last time you thought about it? Probably sometime ago. What has happened to rational subgrouping over time?
One reason it appears that rational subgrouping has been lost is the well-intentioned rush to simplify control charts and only use the individuals (X-mR) control chart. The X-R control chart has taken a back seat to the X-mR control chart. As control charts have moved into the non-manufacturing areas, there is less data available. There might only be data that is available once a day, once a week or once a month. The X-mR control chart is the perfect fit for this infrequent data.
But just because you have infrequent data doesn’t mean you shouldn’t think about how the data was obtained. Are you comparing apples to apples? Does the frequency of your samples make sense? Is it rational?
The reality is that rational sampling and rational subgrouping apply to both the X-mR control chart and to the X-R control chart. This publication is meant to remind you what rational subgrouping is and how to use it.
In this publication:
- Introduction
- Separating the Noise from the Signals
- Rational Sampling
- Control Charts and Variation – The Key to Rational Subgrouping
- X-R Control Charts and Rational Subgrouping
- X-mR Control Charts and Rational Subgrouping
- Summary
- Quick Links
Please feel free to leave a comment at the end of the publication. You can also download a pdf copy of this publication at this link.
Introduction
Dr. Donald Wheeler, in his book Advanced Topics in Statistical Process Control, writes:
“Rational sampling and rational subgrouping form the conceptual basis of Shewhart’s control charts.”
If this is true, why don’t we spend more time thinking about rational sampling and rational subgrouping. The reality is that we don’t spend much time thinking about how we are putting a control chart together. We simply take whatever data we have, put it in a software program, and generate a control chart. You often have your data in one column, and you can pick your subgroup size – 1, 2, 4, 5, – whatever you want, usually without any thought. Maybe you pick 4 because you heard that is a good subgroup size. Which leads to the second quote from Dr. Wheeler’s book:
“With data which are not obtained from a production process in a rational manner, or not subgrouped in a rational manner, a control chart will be nothing more than wallpaper.”
So, how much wallpaper do you have on your wall? Understanding rational subgrouping is a key to effectively using control charts. It is all about variation – as usual. This publication builds on the four previous publications we have on rational subgrouping.
- Rational Subgrouping and X-R Charts (Ma
 y 2005 ): This publication introduced three different sampling plans for four machines.
 - Rational Subgrouping and X-R Charts – Part 2 (June 2005 ): This publication showed the results for the three different sampling plans for four machines and determined the best plan.
- SPC, Rational Subgrouping and Golf (January 2013 ): This publication applied rational subgrouping to golf pro Phil Mickelson tournament over a three-year period.
- SPC and Rational Subgrouping (February 2013 ): This publication examined what variation the and R control chart is monitoring and how rational subgroup applies to that.
 y 2005 ):
We also have video on rational subgrouping. It covers the four machine example in detail.
The 2013 publication talks about how rational subgrouping has been “forgotten.” Not much has changed in that regard in the last 10 years.
Separating Noise from Signals
One reason for monitoring a process over time is to see signals that something has changed in the process. What is needed is a good method of separating the noise from signals. Noise is the natural variation in the process, what is called common causes of variation. Signals represent the variation that is not supposed to be there – what is called special causes of variation. Control charts, done properly, are an excellent method of separating signals from the noise.
In a control chart, points are plotted over time. The average is calculated and added to the chart. Two additional lines are calculated and added to the chart. One is the upper control limit (UCL). This is the largest value you would expect with just common causes of variation present (the noise). The other is the lower control limit (LCL). This is the smallest value you would expect with just common causes of variation present. If there are no points beyond the control limits and no patterns in the data, there is only noise present. The process is consistent and predictable. It is in statistical control.
If there are points beyond the control limits or a pattern (such as a run above the average), the process is not consistent and predictable, and signals are present. It is out of statistical control.
Rational sampling and rational subgrouping, done properly, help you separate the noise from the signals.
Rational Sampling
Rational sampling deals with how you sample your process and how you measure that sample. It is critical that whoever is looking at the control chart understands how the process was sampled and when and how the sample was measured. If you lose any of that information, your data and information will be worthless.
In our publications cited above, there is an example of four machines making the same part. The output streams from the machines are combined later. A control chart is kept on that combined stream. If a sample from the combined stream contains a signal that there is a special cause of variation present, you can’t trace it back to what machine made it, when it was taken or when it was measured. So, your data is not worth anything.
Control Charts and Variation – The Key to Rational Subgrouping
To understand how rational subgrouping works, you need to understand how control charts work. They are intertwined. Control charts monitor variation in a process. The variation being monitored depends on how you have subgrouped the data. Let’s explore the variation being monitored by X-R control charts and by X-mR control charts and how that applies to rational subgrouping. We will start with the X-R control chart.
X-R Control Charts and Rational Subgrouping
The X -R control chart consists of two charts: X and the R. For example, suppose you oversee a process that produces bags of sand. Each bag is to hold a minimum of 50 pounds. Each bag is weighed electronically. If it is more than 50 pounds, it is passed. But this doesn’t really give you any idea of the variation in bag weights. A bag is produced every minute. Every 15 minutes, a bag is removed and weighed manually.
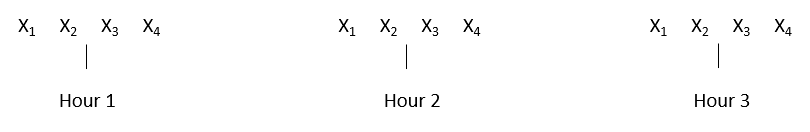
You decide that you want to monitor the variation in bag weights each hour. This is your rational subgrouping. That is the variation you are interested in. So, you take the four samples each hour and form a subgroup. This is shown in Figure 1.
Figure 1: Forming the Subgroups
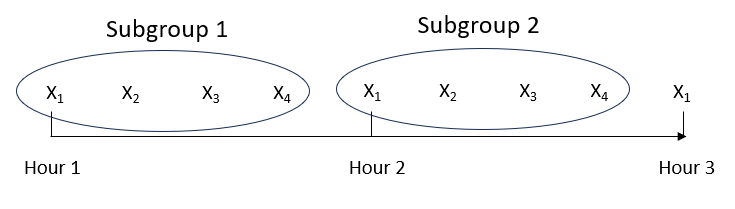
Subgroup 1 consists of the four samples taken every 15 minutes during the first hour. Subgroup 2 consists of the four samples taken every 15 minutes during the second hour. For each subgroup, the average and the range are calculated. The range is the difference between the maximum value and the minimum value in the subgroup.
The subgroup averages are plotted on the X chart and the subgroup ranges on the R chart.
So, what variation is each control chart monitoring?
The X chart is monitoring the differences in subgroup averages from subgroup to subgroup. Each subgroup average is plotted. Each subgroup average represents the hourly average bag weight for that subgroup.
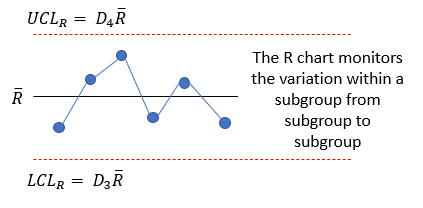
The R chart is monitoring the variation within a subgroup. Each subgroup range is plotted. Each subgroup range represents the variation between values for that subgroup.
Now, lets build on this concept of the variation each control chart is monitoring. We would like the control chart to send us a signal when something is wrong – a signal that a special cause of variation is present. The way this is done with control chart is by calculating and adding the average and control limits to each control chart.
The control limits for the R chart are shown below:
R = SR/k
UCLr = D4R
LCLr = D3R
where D4 and D3 are control chart constants that depend on subgroup size and k is the number of subgroups. R and the control limits are then added to the R chart. If all the subgroup ranges are within the control limits and there are no patterns on the R chart, then the process is said to be in “statistical control” with respect to the subgroup ranges. You want the R chart to be in statistical control – to be consistent and predictable. So, the range chart is looking for consistency within the subgroup ranges. This is shown in Figure 2.
Figure 2: Range Chart Variation
The control limits for the X chart are shown below:
X = SX/k
UCLX = X + A2R
LCLX = X – A2R
where A2 is a control chart constant that depends on subgroup size. The first thing to note about the control limits on the X chart is that they include R in the calculation. The width of the control limits depends on R. This is shown in Figure 3.
Figure 3: X Chart Variation
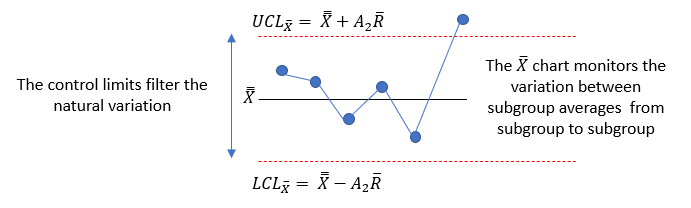
What does this mean? The control limits calculations are such that they use the within subgroup variation (R) to put limits on how much variation should exist between the subgroups (the X values).
The X chart is in statistical control if there no points beyond the control limits and there are no patterns (like 8 in a row above the average). With R being used to set the range of the control limits, the within subgroup variation is being used to define how much variation there should be between the subgroups.
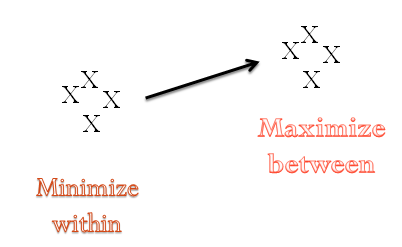
The idea is to minimize the variation in the R chart and maximize the opportunity for variation between the subgroups on the chart.
The R chart should capture the normal variation in the process (i.e., common causes of variation) and the limits on the X chart then filter out the routine variation as shown in Figure 3. Minimizing the R chart variation increases the sensitivity of the X chart to see the signals (out of control points).
Look back at Figure 1 and our sampling plan. Is it the best one? Are there other options? You really can’t apply rational subgrouping to a process unless you are knowledgeable about the process. You should use your process knowledge to determine your sampling plan.
If the objective is to minimize the variation in the R chart and maximize the opportunity for variation in the chart, would it make more sense to take four bags at the start of each hour, as shown in Figure 4?
Figure 4: Sampling Plan to Minimize Variation in Range Chart
This would definitely minimize the variation the R chart and let the X chart do the work of showing the signals. There are often multiple ways the data could be subgrouped.
X-mR Control Charts and Rational Subgrouping
Does rational subgrouping apply to the X-mR control chart? Yes, it does but in a slightly different manner. There are two charts: the X chart where the individual values are plotted and the mR chart where the ranges between successive values are plotted.
How do you have rational subgrouping with individual values? Perhaps you are monitoring the level of a chemical in a stream, and you have one sample per day. How does rational subgrouping play into this? It comes into play with the moving range. The control limits for the X chart are going to be calculated using the average moving range. It means that the moving range between consecutive values must be logically comparable. The difference between consecutive values should represent common causes of variation, the normal variation in the process. These differences are then used on the X chart to determine the control limits and filter out the normal variation on the X chart. The major point here is that you do not want to compare apples and oranges on the individuals control chart.
The control limits for the moving range chart are given by:
R = SR/(k-1)
UCLr = 3.268R
The variation in the mR chart is shown in Figure 5.
Figure 5: mR Control Chart Variation
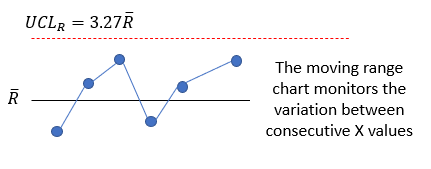
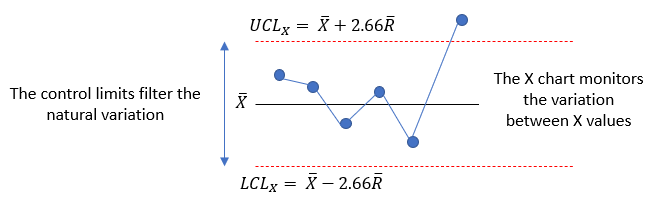
Again, the mR chart is looking for consistency between the moving range values. R is then used in the calculation of control limits for the X chart:
X = SR/k
UCLx = X + 2.66R
LCLx = X – 2.66R
Figure 6 shows how the natural variation is filtered by the control limits.
Figure 6: X Control Chart Variation
Because there is usually infrequent data with the X-mR control chart, there is a tendency not to look at other sample plans. This can be a mistake. Be sure to look carefully at the sources of variation within and between subgroups. Be willing to change sampling to be sure the moving range values represent common causes of variation.
Summary
This publication is a reminder about rational subgrouping. Control charts monitor variation – and the way you subgroup the data impacts that significantly. You want to rationally subgroup the data, so you are exploring the variation you are interested in. Rational subgrouping applies to all control charts. The within subgroup variation is used to filter out the normal variation on the subgroup averages.