Sigma – an important statistic for us to know. Sigma, or the standard deviation, is a measure of how much dispersion there is in a process. There are numerous ways to estimate sigma. One way, of course, is simply to calculate the value using the formula for the standard deviation:
where Xi are the individual results, X is the average and n is the number of individual results.
This is a measure of the dispersion in the data. But is it a good one to use? Does it fairly represent the data? The answer is you don’t know because you haven’t charted the data over time in the form of a control chart. Remember, a standard deviation (or an average or any calculated statistic) has no meaning if the process that generated the data is not in statistical control.
When estimating the variation, you should be using a control chart based on a measure of dispersion – usually either a moving range, a range or a standard deviation chart. If the dispersion chart is in statistical control, then you can estimate the value of sigma.
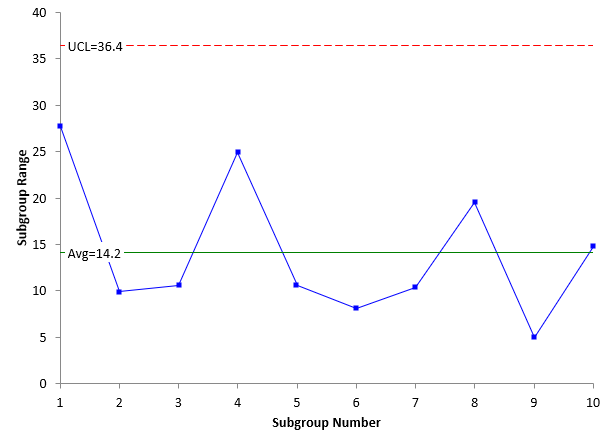
Consider the example data that is our SPC Knowledge Base article The Estimated Standard Deviation and Control Charts. In that example, a subgroup size of 3 was used. The range chart based on the data in the article is shown below.
This range chart is in statistical control. There are no points beyond the limits or any patterns. The process is consistent and predictable. This means that the dispersion is the same over time and you can estimate the dispersion. For a range control chart, sigma is estimated using the following formula:
s = R/d2
where d2 is a control chart constant that depends on the subgroup size. d2 for a subgroup size of 3 is 1.693. The average range from the range chart is 14.2. The estimate of sigma is then:
s = R/d2 =14.2/1.693=8.4
This is the estimate of sigma based on the range control chart. Note that, if the range chart is not in statistical control, the estimated value of sigma is not valid – the process is not consistent, and you don’t know what you will get in the future.
If you used a standard deviation chart, the value of sigma would be calculated as:
s= s/c4
where c4 is a control chart constant that depends on the subgroup size and s is the average subgroup standard deviation.
The control chart constants are given in the SPC Knowledge Base article referenced above.

