Our last blog, A True Story about Variation, showed how leadership was blaming operators for process problems. They did not understand variation. The most powerful method I know for developing an understanding of variation is the red bead experiment. Dr. W. Edwards Deming often referred to it as a stupid experiment that you’ll never forget. I had the privilege to see Dr. Deming perform this experiment in a seminar in 1984.

The experiment begins with six “workers.” Their job is to make 100% white beads. The workers are trained in how to use the paddle to scoop out the beads. Since everyone had the same training, there will be no variation. Each worker puts the paddle into the bead bowl and pulls out his/her daily quota of 50 beads. But what happens? There is variation – not to mention red beads. Tom gets 7 red beads out of his 50 beads. Becky has 12. Oh my gosh, Dave has 14. The workers are producing red beads – and there is variation despite the training. This continues for several days. All sorts of threats and exhortations do not impact how the workers do. In the end, they fail to produce 100% white beads.
Why was that? The system was not designed for 100% white beads. It has 20% red beads in it – making it just about impossible to get all white beads. The workers could not change that fact – they work in the system. They can do no better than the system.
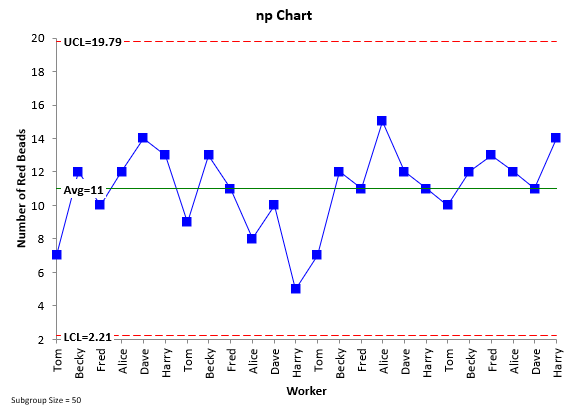
If you plot the number of red beads for each worker on a control chart, you will discover, not surprisingly, that the process is in statistical control. The red beads represent common causes of variation. Below is a plot of the red beads over time from a seminar I gave. All the points are in statistical control.
For a process in statistical control, the workers are doing all that can be done. If you want different results, you must fundamentally change the process!
We have a detailed description of how to conduct the red bead experiment in our SPC Knowledge Base article The Red Beads: Understanding Variation. You can also download a red bead experiment simulator (runs in Excel) there as well.
