Our previous blog introduced histograms. Histograms tell you four things about your process. Remember what those were? If not, see our previous blog, What is a Histogram?. Histograms also can give you insights to things you might not normally see. The example below demonstrates this.
Here is the background information for you. A supplier sends in weekly shipments of one raw material to you. There is one raw material characteristic that is key to how it performs in your process. The supplier provides you with a Certificate of Analysis with each shipment that includes the measured value for this raw material characteristic. You have the last 50 Certificates of Analysis. You use those 50 measured values to construct a histogram with the specifications overlaid.
You believe that the data should be normally distributed. This means that the distribution should be bell-shaped with most of the data near the average. As you move away from the average, there is less and less data.
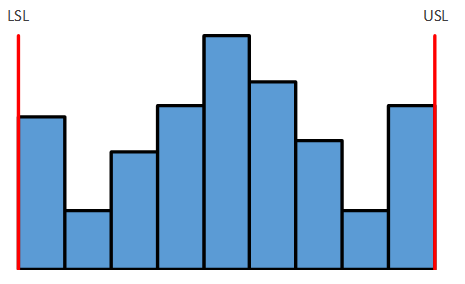
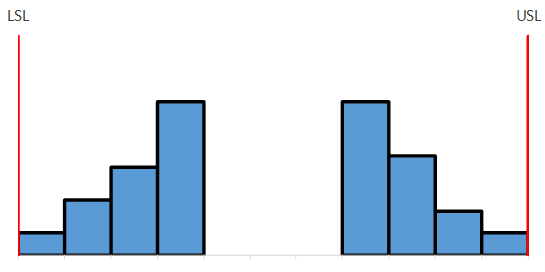
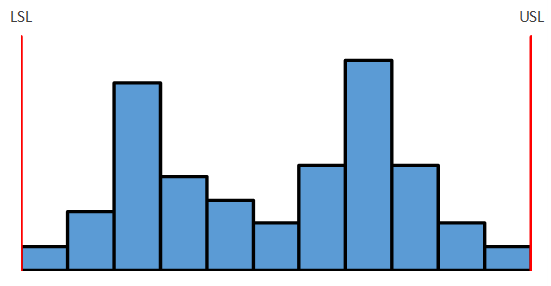
Below are five possible histograms from the data. What does each histogram tell you about your supplier’s process and what impact does that probably have on your process? Please feel free to leave your responses in the comment section.
Histogram 1
Histogram 2
Histogram 3
Histogram 4
Histogram 5
Answers will be in our next blog.


