You hear the term process capability a lot these days. Customers want to know your process capability. You want to know your supplier’s process capability. So, what is meant by the words process capability? For a process:
Process capability is the range of values that you can expect to get from the process over an extended time period.
Suppose your process involves filling bags with sand. Each bag is supposed to hold 50 pounds of sand. The process capability for this process is simply the range of values you expect for the bag weights over an extended time period. Each bag is weighed and entered into a database. After six months – the extended time period – the bag weights range from 50.10 to 50. 37 pounds. This the process capability for your process.
Note that process capability does not mean that the process is capable. That is a different definition.
A process is capable if the range of expected values fall within the specification limits.
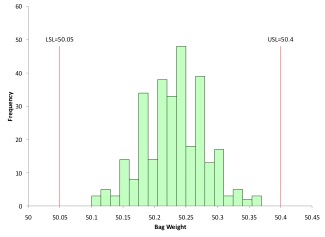
The specification range for the bag weights is 50.05 to 50.4. Since the range of expected values falls within the specification range, the process is capable of meeting the specifications. This is shown in the figure below.
Wait a minute you say. This can’t be all there is to a capable process. What about the Cpk value? Doesn’t it have to be greater than 1.33 now?
Think about the figure above. All the results for the bag weights are plotted in a histogram format for six months. Six months is the extended time period. How long should that time be? Long enough so that all the sources of variation have an opportunity to impact your process. All the plotted results are within the specification limits. So, your process is capable of meeting the specifications.
Unfortunately, this is not enough for most people. Since you are comparing two ranges – the product values range and the specification range – there is a natural tendency to ask “how capable” a process is. Do those ranges overlap? If so, by how much? If not, how close are they to each other? This has given rise to numerical values of process capability, in particular Cpk and Ppk. Our next blog will answer the question what is Cpk?
Our SPC Knowledge base has multiple publications on process capability.
The histogram above was made using SPC for Excel, a simple but powerful software for statistical analysis in the Excel environment.