Our first blog in this process capability series explored the simple question “what is process capability?”. There were two parts to the answer:
Process capability is the range of values that you can expect to get from the process over an extended time period.
A process is capable if the range of expected values fall within the specification limits.
Since you are comparing two ranges – the range of output from the process to the range of the specs – it is natural to ask questions about how much these two ranges are different or overlap. This gave rise to numerical expressions to compare the range of process output to the specification range. One of these is the Cpk value. Numerically, Cpk is expressed as the following:
Cpk = Minimum (Cpu, Cpl)
where Cpu is the capability based on the upper specification limit (USL), Cpl is the capability based on the lower specification limit (LSL), X is the overall average, and? is the estimated standard deviation from a range control chart. Note that ? is not the calculated standard deviation you get from using the basic formula (like the formula STDEV does in Excel).
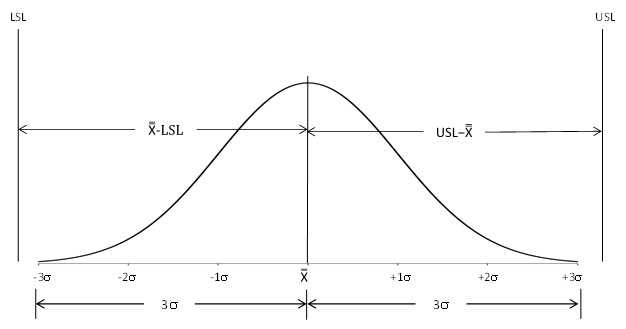
The chart below shows the concept behind Cpu and Cpl.
The bell-shaped (normal) curve represents the output from the process. Essentially all the process output lies in a range of ± 3s of the average. Consider Cpu, the upper capability. It is the ratio of two ranges. USL-the average is measure of how far the USL is from the overall average. 3s is a range from the average to the average + 3s. Cpu is the ratio of these two ranges. If Cpu > 1, this means that the USL is over 3s from the average. This, in turn, means that there is essentially no out of spec material on the high side. If Cpu < 1, this means that the USL is less than 3s from the average. This, in turn, means that there is material that is out of spec on the high side.
The same analysis applies to Cpl. Cpl is a measure of how far the LSL is from the average. If the LSL is more than 3s below the average, then there is essentially no material out of spec on the low side and Cpl > 1. If the LSL less than 3s below the average, then there is material out of spec on the low side and Cpl < 1.
Cpk is simply the minimum of Cpu and Cpl.
There are two things that must be true before you can calculate a Cpk value. First, the process output must be reasonably normally distributed. The calculations of Cpk are based on that assumption. Second, the process must be in statistical control; it must be consistent and predictable. The only way to find this out is to create a control chart based on the process output.
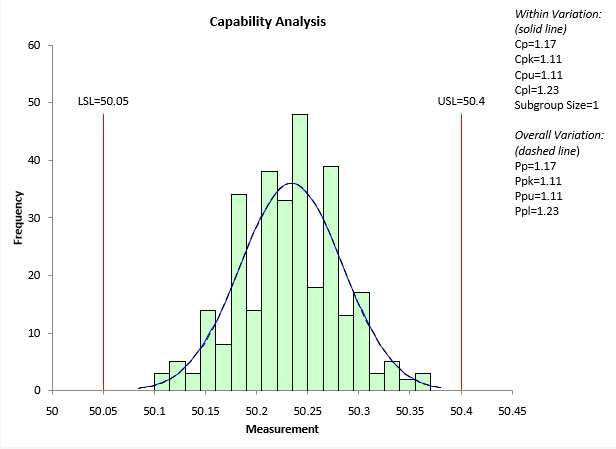
If these two things are true, then you can do a process capability (Cpk) analysis. What does a Cpk analysis look like? An example of a capability analysis from the SPC for Excel software is shown below.
A Cpk analysis shows the histogram of the process output with a normal curve and the specification limits added to the chart. In this example, you can easily see that the process output is within the specification limits. The value of Cpu and Cpl confirm this. Cpu is 1.11 and Cpl is 1.23. So Cpk is 1.11. This means that essentially all the process output is within spec.
As shown in the chart above, there are usually some statistics included with the Cpk analysis. The SPC for Excel software allows you to choose which statistics to include. In this example, only the Cpk and Ppk process capability indices are included.
Ppk? Yes, there is another commonly used process capability analysis metric. That metric is Ppk, which will be the topic of our next blog.
Our SPC Knowledge base has multiple publications on process capability if you would like more details.
The Cpk analysis above was made using SPC for Excel, a simple but powerful software for statistical analysis in the Excel environment.


