January 2012
Our first newsletter of the year goes back to the beginning – variation – just where you should begin with statistical process control – ensuring that everyone understands the concept of variation. The control chart approach to quality (with common and special causes) is totally different from the specification approach to quality.
Focusing on the specification, target, goal, or budget does not lead to process improvement. You must focus on the process. Separating common and special causes of variation will tell you what you need to do to improve your process. Confusing common and special causes almost always leads to losses in the process. A true example in this newsletter shows what can happen. Two great experiments show the impact of confusing common and special causes of variation – the red bead and funnel experiments.
In this issue:
- Variation: common causes and special causes
- Specification approach to quality
- Control chart approach to quality
- Confusing common and special causes
- The red bead and funnel experiments
- Summary
- Quick links
Please feel free to leave comments at the end of the newsletter. Maybe tell a story about how common and special causes were confused.
Variation: Common and Special Causes
Our first newsletter in January 2004 started with variation. Here is what we wrote:
I used to, now and then, spill a glass of milk when I was young. Our table slanted toward where my mother sat. So, the milk always headed in her direction. And she usually had some choice words when this happened. Of course, I was at fault. I needed to be more careful. Or was that really true? If you understand variation, you will realize that most of the problems you face are not due to individual people, but to the process — the way it was designed and the way it is managed on a day-to-day basis.
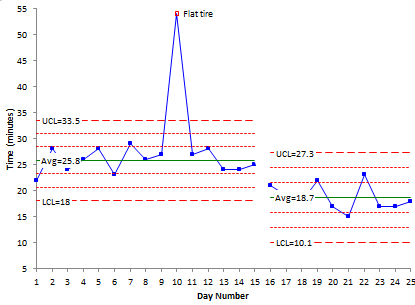
Variation comes from two sources, common and special causes. Think about how long it takes you to get to work in the morning. Maybe it takes you 30 minutes on average. Some days it may take a little longer, some days a little shorter. But as long as you are within a certain range, you are not concerned. The range may be from 25 to 35 minutes. This variation represents common cause variation — it is the variation that is always present in the process. And this type of variation is consistent and predictable. You don’t know how long it will take to get to work tomorrow, but you know that it will be between 25 and 35 minutes as long as the process remains the same.
Now, suppose you have a flat tire when driving to work. How long will it take you to get to work? Definitely longer than the 25 to 35 minutes in your “normal” variation. Maybe it takes you an hour longer. This is a special cause of variation. Something happened that was not supposed to happen. It is not part of the normal process. Special causes are not predictable and are sporadic in nature.
Why is it important to know the type of variation present in your process? Because the action you take to improve your process depends on the type of variation present. If special causes are present, you must find the cause of the problem and then eliminate it from ever coming back, if possible. This is usually the responsibility of the person closest to the process. If only common causes are present, you must FUNDAMENTALLY change the process. The key word is fundamentally — a major change in the process is required to reduce common causes of variation. And management is responsible for changing the process.
It has been estimated that 85 to 94% of the problems a company faces are due to common causes. Only 6 to 15% are due to special causes (that may or may not be people related). So, if you always blame problems on people, you will be wrong at least 85% of the time. It is the process most of the time that needs to be changed. Management must set up the system to allow the processes to be changed.
So, Mom, sorry. But most of the time, spilling the milk was not my fault. It was usually yours (management). The glasses were too big for my small hands (no spill-proof cups in those days). When I wanted to put it by the edge of the table to make it easier to reach, you said move it back – I might spill it. And with the meal-time conversation, how could I concentrate on my milk!
So, first teach the concept of variation. Then the use of control charts (see Separating Common from Special Causes below) will make more sense to people.
 I used to, now and then, spill a glass of milk when I was young. Our table slanted toward where my mother sat. So, the milk always headed in her direction. And she usually had some choice words when this happened. Of course, I was at fault. I needed to be more careful. Or was that really true? If you understand variation, you will realize that most of the problems you face are not due to individual people, but to the process — the way it was designed and the way it is managed on a day-to-day basis.
So simple. So why do we miss this concept so often? It takes a change of mindset to think in terms of common and special causes. It is easier to think in the short term only – how are we doing this month versus last month? How did we do versus budget? We are thinking about the final product – the sales this month, the product being in spec, returns this month, customer complaints this month. All of this thinking just focuses on what our specifications are – whether they are product specifications, targets, budgets or quotas.
Specification Approach to Quality
All this focus on the end of the line began with mass production. It became a question of how similar parts had to be so they could be interchanged. So, our binary view of the world was born. Acceptable product was within specifications. Unacceptable product was out specification.
Acceptable product: within the specifications
Unacceptable product: out of specifications
All about the final product or service. And the process gets lost in that thinking. The irony of all this is that the only way you can improve your final product or service is to focus on the process – and trace variation back to its source to reduce it.
And what happens if we have a problem with a final product or service? Maybe a customer complains. What do you do? In the ISO environment, you probably have a customer complaint resolution procedure. This procedure usually includes finding the root cause of the problem and eliminating it. How many times is the “root cause” a person? And the “solution” is simply retraining that person. If that is the result of your resolution procedure very often, you are wrong most of the time. Remember, the vast majority of our problems come from common causes of variation – due to the way we designed the process and manage it on a day-to-day basis.
Far too often leadership focuses only the final result – with little regard for what it takes to get there. Take the simple case of meeting a sales quota or a production quota. As long as meet those quotas, what does leadership do? Most often, nothing. Maybe if you really exceed the quota, you get a thank you.
What happens if you don’t meet the quota? Do you get any attention? Of course you do. Leadership is there asking what happened. And you have to come up with a reason for missing the quota. Do you find something to report back to leadership? Of course you do. But this takes time and effort – and our answer to leadership is often just some reason you come up with to satisfy leadership. Leadership is happy with the answer because it makes them feel like they are doing something positive. But, in many cases, leadership is just tampering with the process. Again, we are not focusing on the process, but the final result. And this leads to a binary view of the world – either everything is going great (we are meeting our quotas!) or everything is going to pot (we are not meeting our quotas and leadership is asking questions!).
This is what Dr. Don Wheeler called the “specification approach to quality” in his great book “Understanding Variation.” This approach tells you where you are, but “it will not tell you how you got there, and it will not tell you how to get out the mess in which you find yourself.” When faced with a quota (or target or goal), people will tend to do one of three things according to Dr. Wheeler:
- Work to improve the system
- Distort the system
- Distort the data
 The second two are always easier than the first two. Dr. Donald Wheeler has the following example in his book. Production quotas were important in a plant. If it looked like that quota would not be met, a foreman sent a forklift to the finished goods warehouse to bring back skids of product. The finished product was unpacked, loaded on the conveyor and sent down the packing line. There automatic counters recorded them as finished product.
Of course, there were now material shortages in the warehouse – a million dollars worth – enough to get the plant manager fired. The new plant manager watched production very closely. But the foreman continued the same practice. At the end of the year, there was still about a million dollars missing in inventory. The plant manager was fired.
The next plant manager took inventory after three months. The inventory was short about $250,000. The plant manager built a fence around the plant site and put guards the gate. Another inventory was taken after three months. Now they were short a half million dollars. So, the plant manager built a fence around the warehouse and placed a guard at the gate. That stopped the inventory problem but it sure put a dent in the production figures. All because of the focus on the goal – not on the process.
Control Chart Approach to Quality
The control chart approach to variation is totally different than the specification approach. The control chart approach has nothing to do with specifications. Instead, the focus is on two different types of variation: common causes and special causes as defined above. Why do we want to know if we have common or special causes present? Because it tells you what you need to do to improve your process. If only common causes of variation are present, you must fundamentally change the process. If special causes of variation are present, you must find the root cause and prevent it from occurring again. The only effective way to separate common from special causes of variation is through the use of control charts.
For an in-depth look at the purpose of control charts, please see our March 2011 newsletter. In that newsletter, we develop the control chart below for driving to work. It shows a special cause of variation (a flat tire). It also shows process improvement after the process was fundamentally changed to lower the average (addressing common causes of variation).
Confusing Common and Special Causes of Variation
 Mixing up common and special causes occurs far too frequently. The following is a true story. A plant produced a number of different powdered products. Each of these products were run through the same production equipment at different conditions and put into unique silos (one or more for each product type). To ensure that the product went to the correct silo, an operator had to set up the lines from the process to the correct silo. If product was introduced into the wrong silo, the entire silo had to be sold as off- grade, at a tremendous reduction in price. The cost was typically $30,000 per incident.
The plant leadership had a policy that anyone who cross-contaminated a silo received three days off with no pay. What type of variation did leadership assume was present? Special cause. They assumed that the operators were at fault. One manager said that he was not going to “idiot proof” the plant.
Was leadership correct? The only way to find out is to collect data. It turns out that anyone who had worked in the unit for more than 3 months had time off for cross- contaminating a silo. If everyone is doing it, what type of variation is it? Common cause. And the only way to reduce common cause of variation is to change the process. Leadership put together a team that worked on the problem. The team came up with two simple solutions: label the lines and put better lights out at night. Easy solutions but beyond the authority of the operators to get done by themselves. With the solutions implemented, the problem, which had been occurring almost monthly, went away entirely. So simple if you understand variation.
The Red Bead and the Funnel Experiments
There are two great experiments you can do to show the difference between common and special causes and what happens when you adjust a process without using your knowledge of variation.
 The most powerful method I know for developing an understanding of variation is the red bead experiment. Dr. W. Edwards Deming often referred to it as a stupid experiment that you’ll never forget. I had the opportunity to see Dr. Deming perform this experiment in a seminar in 1984.
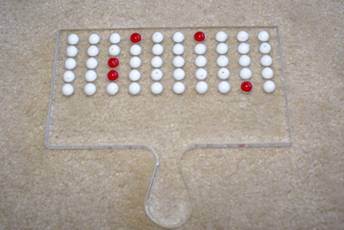
In this experiment, there is a bowl containing red and white beads. The objective is for a worker to produce only white beads. There is a paddle with 50 impressions. A worker puts the paddle into the bowl and extracts the beads. Of course, the percentage of red beads is such there is a very small probability of getting all white beads. So, the worker will produce some red beads. There are multiple workers.
The workers do not get the same number of red beads each time. The “foreman” berates the workers who do the worse and praises the workers who do the best. The red beads represent common causes of variation and the only way to improve the process is to remove the red beads. For more on the red bead experiment (including a red bead simulation in Excel you can download for free), please see our February 2009 newsletter – and you will see that I have used the milk story more than twice in these newsletters!
 In any process, there is the danger of over-controlling the process if one uses some knowledge of variation. Dr. Deming said “If anyone adjusts a stable process for a result that is undesirable, or for a result that is extra good, the output that follows will be worse than if he had left the process alone.” This is often called tampering with the process. It is something that is done often by front line personnel and very often by management. This increases variation as well as losses in a process. Doing your best is no longer sufficient. You must know what to do.
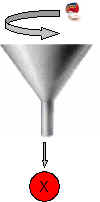
An excellent example of over-controlling is the funnel experiment described by Dr. Deming. The objective of the funnel experiment is to drop a marble through a funnel and hit a target.
A point on a level surface is designated as the target. A funnel is held a certain distance above the surface. A marble is dropped through the funnel. The spot the marble comes to rest on the surface is marked. This is repeated for at least 50 drops for each of four different rules. The four rules are:
- Rule 1: Leave the funnel fixed over the target.
- Rule 2: For every drop, the marble will come to rest a distance “z” from the target. Rule 2 is to move the funnel a distance -z from its last position.
- Rule 3: Move the funnel a distance -z from the target after each drop of the marble that ends up a distance z from the target. Note that Rule 2 moves the funnel based on the funnel’s last position. Rule 3 moves the funnel a distance from the target.
- Rule 4: Rule 4 is simply to set the funnel over where the last drop came to rest.
The first two rules produce processes in statistical control, but Rule 1 has much less variation because there is no tampering. Rules 3 and 4 are not stable processes. To see computer simulations of the results, please see our July 2006 newsletter. This newsletter also contains examples of each rule in real life.
Summary
This newsletter has taken look back at the basics of variation. Common and special causes were defined along with the specification approach to quality and the control chart approach to quality. The red bead and the funnel experiments are great for showing the difference between common and special causes as well as what happens when you tamper with a process.
This was an EXCELLENT review. I have also enjoyed, and continue to do so, Dr. Wheeler's book on Understanding Variation. I always enjoy your newsletters and especially this one. Thank you!
Thanks for bringing back memories of my early SPC training. Hard to believe it has been over 25 years, but Dr. Deming's teachings are just as relevant today, probably more so.
I wish and hope younger managers today have the opportunity to learn and embrace his 14 points.
Clay@precisepackagingservices.com