March 2026
 America’s favorite pastime, baseball, kicked off the 2026 season with a game between the New York Yankees and the San Franciso Giants on March 25, 2026. The Yankees won 7 to 0. America’s favorite pastime is back for 2026.
Baseball generates a lot of data. It’s a numbers game for sure. And this data is generated over time. Lots of data, generated over time – perfect for control charts to analyze the data. There is data generated at the individual player level, at the team level, at the league level and overall baseball level.
For example, several years there was a concern that a baseball game took too long to play – over 3 hours. So, they made some changes, like requiring a pitcher to throw a pitch within a certain time. Did this change make a difference? The control chart is perfect for determining this.
A pitcher has a game where his earned run average is very high. Is this a signal something has changed? Or is it just noise in the process. Again, the control chart is perfect for determining that.
This publication takes a look at how control charts can be used to analyze the metrics from baseball. In this publication:
- Control Charts Review
- Tarik Skubal ERA Control Chart
- Length of a Game Control Chart
- Summary
- Quick Links
Please feel free to leave a comment at the end of this publication. You can download a pdf copy of this publication at this link.
Our SPC for Excel software handles the control charts you need directly in Excel! Try the free 30-day demo now!
Control Chart Review
We will start with a quick review of control charts. A control chart monitors variation in a process over time. It separates common causes of variation from special causes of variation. Common causes of variation represent the “noise” in the process. It is the normal or natural variation that exists in the process. A special cause of variation represents a “signal” that something has changed in the process . It is not supposed to be there.
A control chart separates the common causes of variation from the special causes of variation. All processes have noise – the common causes of variation. Some processes have signals – the special causes of variation that indicate something has changed. When a special cause of variation exists, you should find the reason for the special cause and remove it from the process – hopefully preventing it from coming back again. For more information on variation, please see our SPC Knowledge Base articles at this link.
A control chart is the only effective way to separate signals from the noise. This is done by plotting the data over time. Once you have enough data, you calculate the average and the control limits. There are usually two control limits. One is the upper control limit (UCL). This is the largest value you would expect if you just had common causes of variation present. The other is the lower control limit (LCL). This is the smallest value you would expect if you just had common causes of variation present.
After you have plotted the average and control limits, you interpret the control charts. If there are no points beyond the control limits or patterns (like 8 in a row above the average), the process only has common causes of variation (noise) present. The process is said to be in statistical control. If there is a point beyond the control limits or patterns present, then the process is sending a signal that something has changed.
We will now look at two examples of how control charts can be used in baseball: ERA and length of a game.
Tarik Skubal ERA Control Chart
We will start with a pitcher’s earned run average (ERA). We will use the individuals (X-mR) control chart. For more information on individuals control chart, please see our SPC Knowledge Base article at this link. Tarik Skubal is a left handed pitcher for the Detroit Tigers. In 2025, he won 13 games and lost 6 games. He had a 2.21 ERA for the season. This is the earned runs, on average, he allowed for a 9 inning game. He won the Cy Young award the past two seasons, as the best pitcher in the American League. There are two leagues in major league baseball: American League (AL) and the National League (NL).
Suppose we want to track his ERA using a control chart. The data in Table 1 shows his ERA for each of his 31 starts in 2025. The data are from Baseball Reference.
Table 1: Tarik Skubal ERA by Game for 2025 Season
|
Date |
IP |
ER |
ERA (9 Inning) |
Date |
IP |
ER |
ERA (9 Inning) |
|
|
3/27/2025 |
5 |
4 |
7.20 |
6/29/2025 |
7 |
0 |
0.00 |
|
|
4/2/2025 |
5.2 |
3 |
4.76 |
7/6/2025 |
7 |
0 |
0.00 |
|
|
4/8/2025 |
6 |
0 |
0.00 |
7/11/2025 |
5 |
4 |
7.20 |
|
|
4/14/2025 |
7 |
0 |
0.00 |
7/20/2025 |
6.2 |
1 |
1.35 |
|
|
4/20/2025 |
5 |
2 |
3.60 |
7/26/2025 |
6 |
0 |
0.00 |
|
|
4/27/2025 |
6 |
0 |
0.00 |
8/2/2025 |
7 |
3 |
3.86 |
|
|
5/2/2025 |
6 |
1 |
1.50 |
8/8/2025 |
4.2 |
4 |
7.71 |
|
|
5/9/2025 |
7 |
1 |
1.29 |
8/14/2025 |
7 |
3 |
3.86 |
|
|
5/14/2025 |
6.1 |
5 |
7.11 |
8/19/2025 |
7 |
0 |
0.00 |
|
|
5/20/2025 |
5.2 |
3 |
4.76 |
8/25/2025 |
6.2 |
1 |
1.35 |
|
|
5/25/2025 |
9 |
0 |
0.00 |
8/31/2025 |
7 |
0 |
0.00 |
|
|
5/31/2025 |
7 |
0 |
0.00 |
9/6/2025 |
7 |
0 |
0.00 |
|
|
6/6/2025 |
7.2 |
1 |
1.17 |
9/12/2025 |
3.1 |
4 |
10.80 |
|
|
6/12/2025 |
7 |
0 |
0.00 |
9/18/2025 |
6 |
1 |
1.50 |
|
|
6/19/2025 |
5.2 |
2 |
3.18 |
9/23/2025 |
6 |
1 |
1.50 |
|
|
6/24/2025 |
6 |
4 |
6.00 |
In Table 1, IP is the number of innings pitched, ER is the number of earned runs he allowed for that game, and ERA (9 Inning) is the ERA for the game based on a nine-inning game.
Most of the data on ERA is cumulative – giving his cumulative ERA for the season. We want to analyze the data using the ERA for each individual game. The tables will often give the number of innings he pitched and the earn runs he gave up for each game. You can use that data to calculate the ERA for each game using the following:
ERA = (Earned Runs)*9/(Innings Pitched)
Each inning in baseball has three outs. You have to take this into account when determining the number of innings pitched. For example, suppose a pitcher is removed from the ballgame after one out in the fifth inning. It is said he pitched 5.1 innings. After two outs, it is 5.2 innings. But you can’t use the “.1” and “.2” in the formula above. You first have to convert the data so one out is .3333 and two outs is 0.6667. You can use this formula in Excel to do that:
Innings pitched =INT(IP) + (MOD(IP,1)*10)/3
where IP is the innings pitched in the format 5.1, 6.2, etc.
Consider the second game in Table 1. The innings pitched is 5.2, meaning he pitched until there were two outs in the fifth inning. This corresponds to 5.6667 innings using the formula above. He allowed three earned runs. So, his ERA for the second game, based on 9 innings is:
ERA (9 Innings) = (Earned Runs)*9/(Innings Pitched) = 3*9/5.6667 = 4.76
Figure 1 is the X control chart for the ER for each game, based on 9 innings. All charts made in this publication were made using the SPC for Excel software.
Figure 1: X Chart for Tarik Skubal ERA by Game for 2025 Season
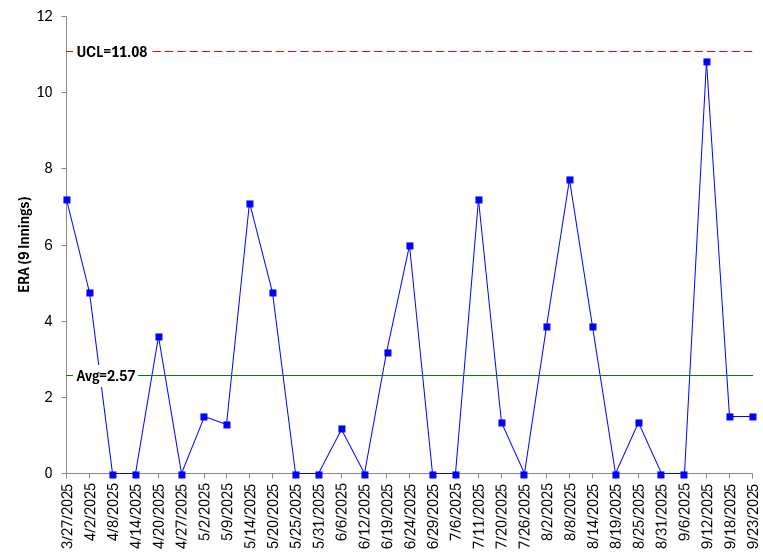
This control chart appears to be in statistical control. There are no points beyond the control limits and no patterns. His pitching process is in statistical control. You can predict what it will be in the future. His ERA for a single game will average 2.57 but could be as low as 0 or as high as 11.
Length of a Game Control Chart
Baseball games last 9 innings unless the score is tied and it goes into extra innings. The length of a baseball game varies because it depends on many things – the number of hits, the number of runs, the number of walks, etc. Table 2 shows the average yearly game length for the AL and NL.
Table 2: Average Baseball Game Length
|
Year |
AL |
NL |
Year |
AL |
NL |
|
|
2000 |
178 |
168 |
2013 |
175 |
165 |
|
|
2001 |
174 |
164 |
2014 |
183 |
173 |
|
|
2002 |
172 |
162 |
2015 |
183 |
173 |
|
|
2003 |
168 |
158 |
2016 |
186 |
176 |
|
|
2004 |
171 |
161 |
2017 |
186 |
176 |
|
|
2005 |
170 |
160 |
2018 |
183 |
173 |
|
|
2006 |
172 |
162 |
2019 |
179 |
169 |
|
|
2007 |
174 |
163 |
2020 |
177 |
167 |
|
|
2008 |
173 |
163 |
2021 |
191 |
179 |
|
|
2009 |
172 |
162 |
2022 |
186 |
177 |
|
|
2010 |
172 |
162 |
2023 |
161 |
158 |
|
|
2011 |
171 |
161 |
2024 |
156 |
157 |
|
|
2012 |
173 |
163 |
2025 |
158 |
159 |
The run chart in Figure 2 below shows the yearly average game length (9 innings) for the AL and NL since 2000.
Figure 2: Average Baseball Game Length per Year
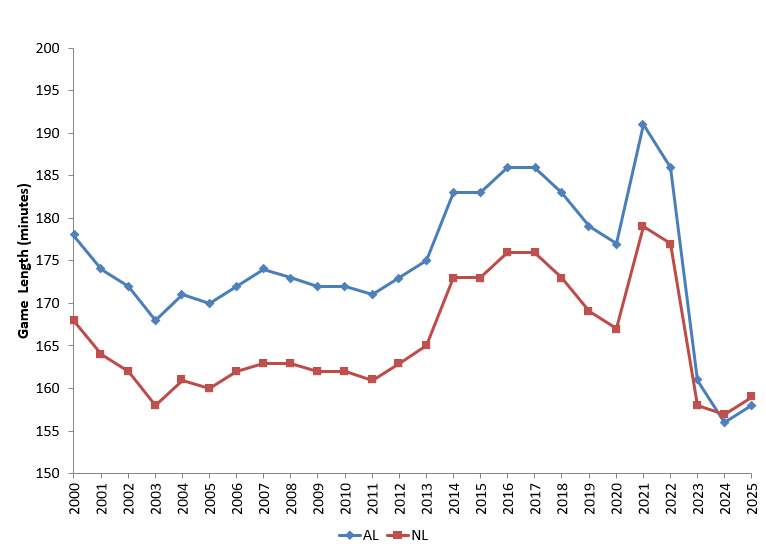
As you can see in the chart, the AL games took significantly longer than the NL games from 2000 to 2022. There were a number of reasons for this. One is that the NL required the pitchers to bat just like any other player; on the other hand, the AL has a designated hitter who hit instead of the pitcher. The AL games tended to have more hits, more runs, etc. – all which led to longer games.
The average game length in 2021 was 3 hours per game. Many thought the game was taking too long and would lose viewers. So, some changes were implemented. The big change came in 2023 when both leagues adopted a pitch clock. The pitcher had to throw a pitch within a certain time.
So does a control chart give us more information than the run chart? Yes, it does. Let’s use an individuals (X-mR) control chart to analyze the results for the AL and for the NL. We will just look at the X chart here. Figure 3 is the X chart for the average game length in the AL.
Figure 3: AL Average Game Length per Year
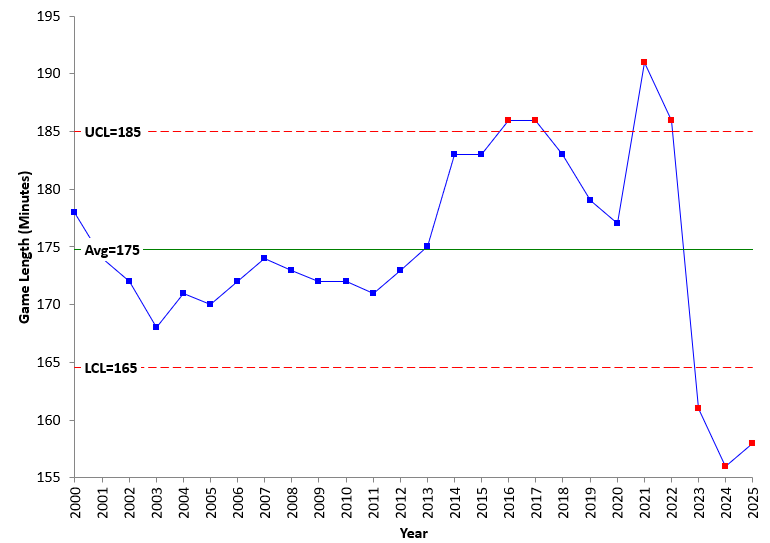
The control chart is definitely not in control. There are points above the UCL and points below the LCL. Plus there is a long run below the average for 2001 to 2012. One great thing about control charts is that you split the control limits to reflect different processes over time. It is easy to see that this chart could be split in two places: 2013 and 2023. The resulting control chart is shown in Figure 4.
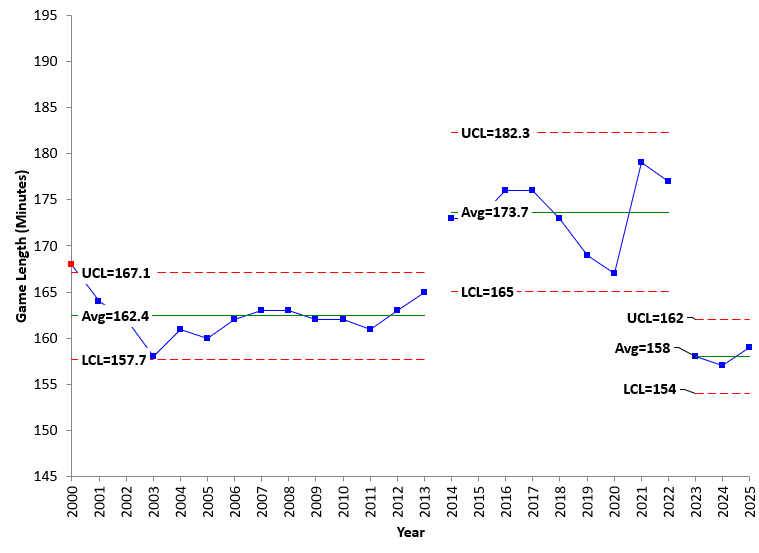
Figure 4: X Chart for AL Average Game Length with Split Control Limits
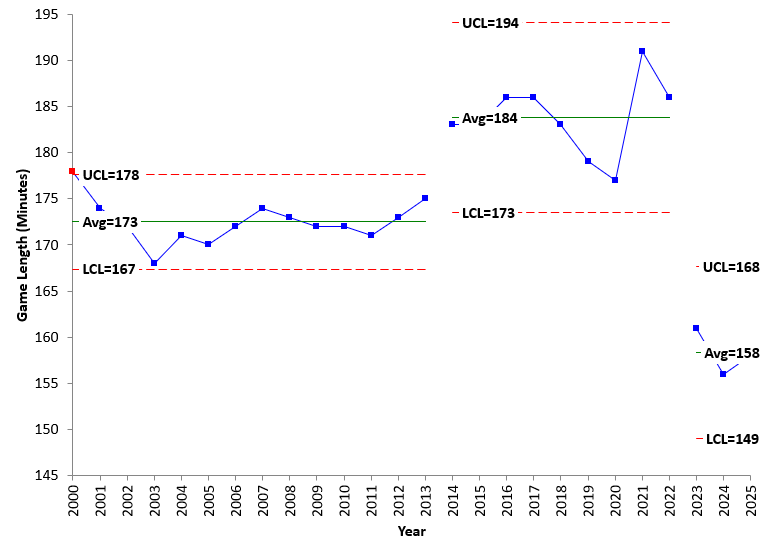
This control chart shows that the “out of control” chart in Figure 3 is really three in-control periods: from 2000 to 2012, 2014 to 2022, and 2023 to 2025. All three periods are in control. So what happened in the AL to cause the step change up in 2014 and the step change down in 2023?
In 2014, major league baseball (MLB) introduced expanded instant replay, allowing managers to challenge many more types of calls (safe/out, fair/foul, etc.). This led to a significant increase in the average game length. The huge change occurred in 2023 when MLB instituted a pitch clock, requiring a pitcher to throw the next pitch. This reduced the average game length from 184 minutes to 158 minutes in the AL.
The NL control chart will look similar to the AL since the two look very similar as seen in the run chart in Figure 2. The control chart for the NL is shown in Figure 5.
Figure 5: X Chart for NL Average Game Length with Split Control Limits
The NL shows the same drop in average game length as the AL. In fact, the last three years the average game length for the NL and AL is about 158 minutes.
Summary
Baseball has many, many metrics. Control charts can be used to determine when the variation you see in the metric is just due to noise in the process or if there is a signal in the data. Two examples, ERA and length of a game were examined.
The SPC for Excel software handles all your control chart needs – from creating to interpreting the control charts!