July 2023
We predict things all the time. For example, we are always interested in the weather. Will it rain tomorrow? Will it be hot? What about the day after tomorrow? Wh at about next month? What about next year? We don’t control the weather, so we try to predict it. How do we do that?
This publication examines using control charts to help predict the future. Plotting data over time is a great start to help understand what is happening in a process. Plotting the data in control chart format helps gain even more insights into the process.
How can the past help us predict the near future with something like the weather? We will show one way this is possible by examining the number of tropical storms and hurricanes in the North Atlantic over the last 100 years using control charts.
In this publication:
- Prediction from NOAA
- Hurricane Data
- Tropical Storms Analysis
- Hurricane Analysis
- Major Hurricanes Analysis
- Other References to Climate Based Articles
- Summary
- Quick Links
Please feel free to leave a comment at the end of this publication. You can also download a pdf copy at this link.
Prediction from NOAA
The following is from the National Oceanic and Atmospheric Administration’s website for their hurricane prediction for 2023.
“NOAA forecasters with the Climate Prediction Center, a division of the National Weather Service, predict near-normal hurricane activity in the Atlantic this year. NOAA’s outlook for the 2023 Atlantic hurricane season, which goes from June 1 to November 30, predicts a 40% chance of a near-normal season, a 30% chance of an above-normal season and a 30% chance of a below-normal season.
NOAA is forecasting a range of 12 to 17 total named storms (winds of 39 mph or higher). Of those, 5 to 9 could become hurricanes (winds of 74 mph or higher), including 1 to 4 major hurricanes (category 3, 4 or 5; with winds of 111 mph or higher). NOAA has a 70% confidence in these ranges.”
There is no doubt that a lot of fancy models and statistics go into making this prediction. What can something as simple as a control chart tell us about the tropical storms and hurricanes? Let’s find out.
Hurricane Data
The data used in this publication is from the National Hurricane Center. You may download the data used in this publication at this link to the National Hurricane Center. The data is from 1851 to 2022. For this publication, we will use the data from the last 100 years (1923 to 2022). These data are shown in Table 1. The data includes the number of tropical storms, hurricanes, and major hurricanes per year. A major hurricane is one with a category of 3 or more on the Saffir-Simpson hurricane wind scale. This scale goes from 1 to 5 with the larger numbers being more severe.
Table 1: Hurricane Data
| Year | Tropical Storms | Hurricanes | Major Hurricanes | Year | Tropical Storms | Hurricanes | Major Hurricanes | |
| 1923 | 9 | 4 | 1 | 1973 | 8 | 4 | 1 | |
| 1924 | 11 | 5 | 2 | 1974 | 11 | 4 | 2 | |
| 1925 | 4 | 1 | 0 | 1975 | 9 | 6 | 3 | |
| 1926 | 11 | 8 | 6 | 1976 | 10 | 6 | 2 | |
| 1927 | 8 | 4 | 1 | 1977 | 6 | 5 | 1 | |
| 1928 | 6 | 4 | 1 | 1978 | 12 | 5 | 2 | |
| 1929 | 5 | 3 | 1 | 1979 | 9 | 6 | 2 | |
| 1930 | 3 | 2 | 2 | 1980 | 11 | 9 | 2 | |
| 1931 | 13 | 3 | 1 | 1981 | 12 | 7 | 3 | |
| 1932 | 15 | 6 | 4 | 1982 | 6 | 2 | 1 | |
| 1933 | 20 | 11 | 6 | 1983 | 4 | 3 | 1 | |
| 1934 | 13 | 7 | 1 | 1984 | 13 | 5 | 1 | |
| 1935 | 8 | 5 | 3 | 1985 | 11 | 7 | 3 | |
| 1936 | 17 | 7 | 1 | 1986 | 6 | 4 | 0 | |
| 1937 | 11 | 4 | 1 | 1987 | 7 | 3 | 1 | |
| 1938 | 9 | 4 | 2 | 1988 | 12 | 5 | 3 | |
| 1939 | 6 | 3 | 1 | 1989 | 11 | 7 | 2 | |
| 1940 | 9 | 6 | 0 | 1990 | 14 | 8 | 1 | |
| 1941 | 6 | 4 | 3 | 1991 | 8 | 4 | 2 | |
| 1942 | 11 | 4 | 1 | 1992 | 7 | 4 | 1 | |
| 1943 | 10 | 5 | 2 | 1993 | 8 | 4 | 1 | |
| 1944 | 14 | 8 | 3 | 1994 | 7 | 3 | 0 | |
| 1945 | 11 | 5 | 2 | 1995 | 19 | 11 | 5 | |
| 1946 | 7 | 3 | 0 | 1996 | 13 | 9 | 6 | |
| 1947 | 10 | 5 | 2 | 1997 | 8 | 3 | 1 | |
| 1948 | 10 | 6 | 4 | 1998 | 14 | 10 | 3 | |
| 1949 | 16 | 7 | 2 | 1999 | 12 | 8 | 5 | |
| 1950 | 16 | 11 | 6 | 2000 | 15 | 8 | 3 | |
| 1951 | 12 | 8 | 3 | 2001 | 15 | 9 | 4 | |
| 1952 | 11 | 5 | 2 | 2002 | 12 | 4 | 2 | |
| 1953 | 14 | 7 | 3 | 2003 | 16 | 7 | 3 | |
| 1954 | 16 | 7 | 3 | 2004 | 15 | 9 | 6 | |
| 1955 | 13 | 9 | 4 | 2005 | 28 | 15 | 7 | |
| 1956 | 8 | 4 | 2 | 2006 | 10 | 5 | 2 | |
| 1957 | 8 | 3 | 2 | 2007 | 15 | 6 | 2 | |
| 1958 | 10 | 7 | 5 | 2008 | 16 | 8 | 5 | |
| 1959 | 11 | 7 | 2 | 2009 | 9 | 3 | 2 | |
| 1960 | 7 | 4 | 2 | 2010 | 19 | 12 | 5 | |
| 1961 | 11 | 8 | 7 | 2011 | 19 | 7 | 4 | |
| 1962 | 5 | 3 | 1 | 2012 | 19 | 10 | 2 | |
| 1963 | 9 | 7 | 2 | 2013 | 14 | 2 | 0 | |
| 1964 | 12 | 6 | 6 | 2014 | 8 | 6 | 2 | |
| 1965 | 6 | 4 | 1 | 2015 | 11 | 4 | 2 | |
| 1966 | 11 | 7 | 3 | 2016 | 15 | 7 | 4 | |
| 1967 | 8 | 6 | 1 | 2017 | 17 | 10 | 6 | |
| 1968 | 8 | 5 | 0 | 2018 | 15 | 8 | 2 | |
| 1969 | 18 | 12 | 5 | 2019 | 18 | 6 | 3 | |
| 1970 | 10 | 5 | 2 | 2020 | 30 | 14 | 7 | |
| 1971 | 13 | 6 | 1 | 2021 | 21 | 7 | 4 | |
| 1972 | 7 | 3 | 0 | 2022 | 14 | 8 | 2 |
Let’s see how we can build our control charts to try to develop something useful to us. Remember, we want to use this information to predict what will happen in the near future. For this to happen, there has to be periods of consistency in the near past.
We will use the individuals (X-mR) control chart in the analysis. However, the moving range chart will not be shown. We will focus on the X chart starting with the number of tropical storms per year.
Tropical Storms Analysis
The X chart for the number of tropical storms per year for the past 100 years is shown in Figure 1. All the control charts in this publication were made using the SPC for Excel software.
Figure 1: X Chart for Number of Tropical Storms per Year
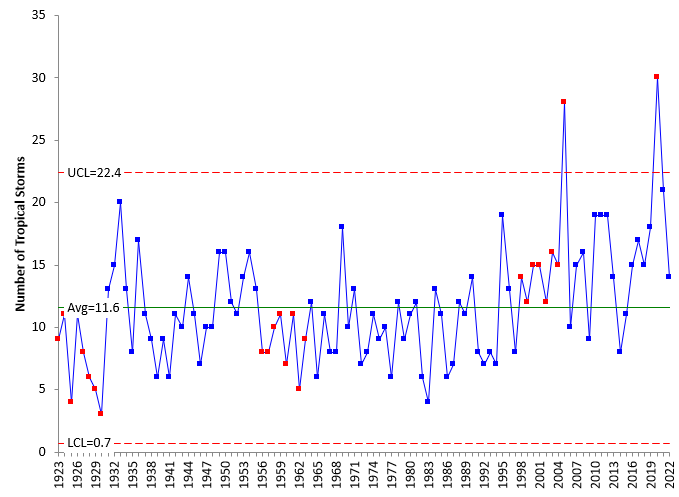
With an X chart, each individual point (number of tropical storms per year) is plotted. The average is then calculated and added to the X chart. The average for the data from 1923 to 2022 is 11.6. This means that there are 11.6 tropical storms per year on average for this 100 year time period. The control limits are then added. There are two – the lower control limit and the upper control limit. The control limits define the bounds of “normal” variation in the process – the range of common causes of variation. The range is 0.7 to 22.4 for the number of tropical storms per year
A process is said to be consistent and predictable (in statistical control) if there are no points beyond the control limits and no patterns present (like 8 in a row above or below the average). Points beyond the control limits and a run of 8 above or below the average were used to interpret the X chart in Figure 1 for statistical control. Red points in Figure 1 represent out of control points. You can see that there are 2 out of control points and 3 runs of 8 or more points on one side of the average. This means that, taken as a whole, the time period from 1923 to 2022 is not in control – not consistent and predictable. And we need consistent and predictable periods to make predictions.
But not all is lost. We are going to look at the X chart for periods of stability. Look at Figure 1. Do you see any periods of stability? The runs below and above the average can sometimes help to identify areas of stability if there are any.
I see at least four potential areas of stability in Figure 1. These are shown in Figure 2.
Figure 2: X Chart for Number of Tropical Storms per Year – Potential Areas of Stability
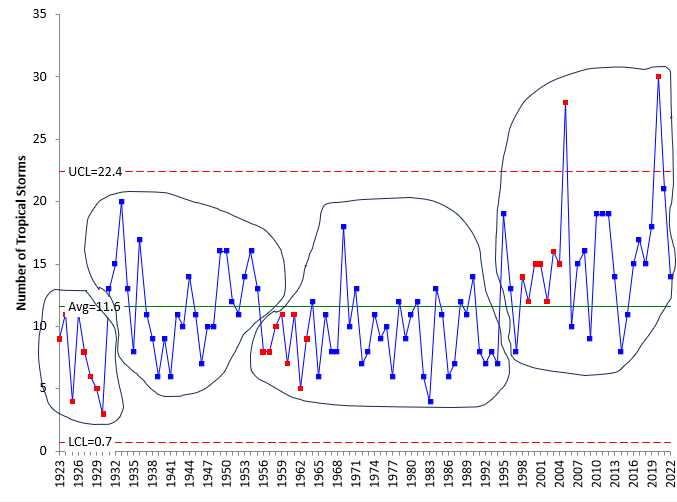
To confirm that these are areas of stability, you can split the control limits at the start of each new period. Based on Figure 2, these new periods start in 1931, 1956 and 1995. The X chart with split control limits is shown in Figure 3.
Figure 3: X Chart for Number of Tropical Storms per Year – Split Control Limits
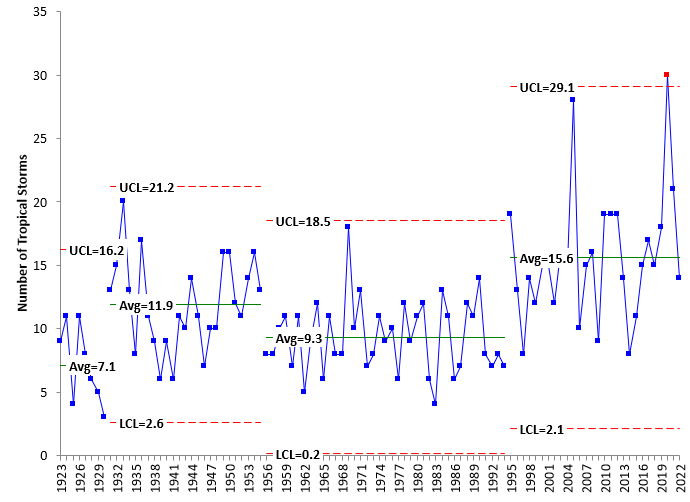
Each period in Figure 3 appears to be fairly stable – consistent and predictable. There is one out of control point in 2020 when there were 30 tropical storms. One out of control year out of 28 years. That is still pretty consistent and predictable.
Figure 3 also shows a pattern of low activity, followed by high activity. It looks like the pattern repeats. This might be of interest to you to find out why, but we are interested in the last period, which we will use to make predictions.
We can use the last period then to make predictions about 2023. The average for the last period is 15.6 with control limits of 2.1 to 29.1. This means, that as long as the process remains the same, the number of tropical storms each year will range from 3 to 29 with a long-term average of 15.6. But this range is not very useful for predictions. It is too wide.
For our prediction range, we will make use of the empirical rule which states about 60 to 75% of the points will lie within one sigma of the average. We need an estimate of sigma to do the calculations. Since this is an individuals control chart, the control limits are based on ± 3 sigma. So,
Sigma = (UCL – Average)/3 = (29.1 – 15.6)/3 = 4.5
The control chart gives the three things we need for prediction: an area of stability, the average, and sigma. The predicted range within ± one sigma is:
15.6 ± 4.5 or 11.1 to 20.1
We are predicting then that there will be 12 to 20 tropical storms in 2023. It is 12 because you round the lower value up and the upper value down, so they are within ± one sigma of the average. You could also consider removing the one out of control point and recalculating the information above.
The NOAA estimated there will be 12 to 17 named storms in 2023. This matches well with the data in Figure 3 with an average of 15.6 and 12 to 20 storms within ± one sigma.
The same analysis can be done for the number of hurricanes and the number of major hurricanes per year. This is done below, but just summarized.
Hurricane Analysis
Figure 4 shows the results of the analysis for the number of hurricanes per year.
Figure 4: X Chart for Number of Hurricanes per Year
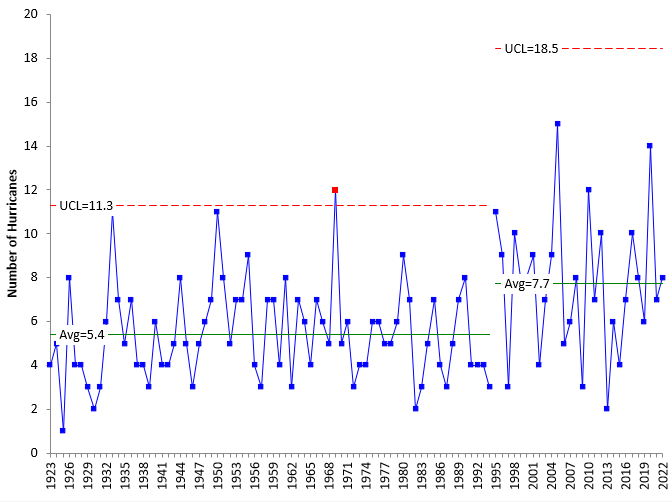
There only appear to be two areas of stability. Interestingly, the split is in the year 1995 – the same year as for the last area of stability for the number of tropical storms per year. Sigma for the last 28 years is determined as above:
Sigma= (UCL – Average)/3 = (18.5 – 7.7)/3 = 3.6
The average ± one sigma is given by 5 to 11. The NOAA has predicted 5 to 9 hurricanes for 2023, which falls in line with the control chart analysis.
Major Hurricane Analysis
Figure 5 shows the results for the analysis of the number of major hurricanes per year.
Figure 5: X Chart for Number of Major Hurricanes per Year
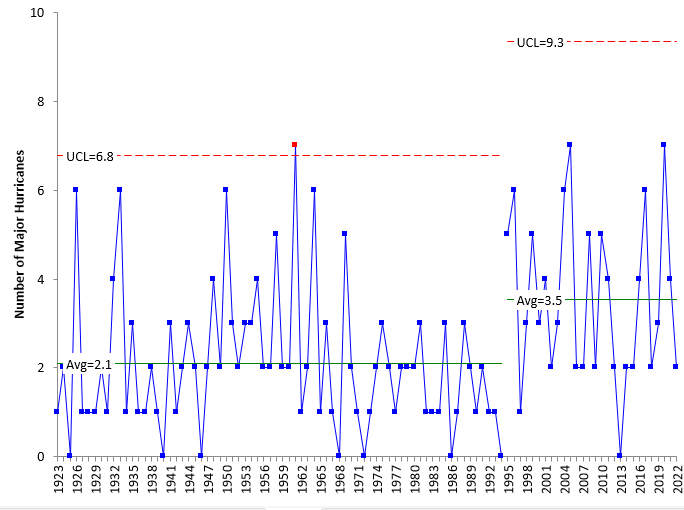
In reality, as you look for periods of stability, you only need to find the last one, unless you are interested in seeing if patterns are repeating for some reason or looking for trends. 1995 is once again the year where the current period of stability begins. It doesn’t matter what happened before that because we are using the control chart to predict what will happen in the future. Based on this analysis, we can expect from 0 to 9 named hurricanes per year with a long-term average of 3.5. The value of sigma is:
Sigma = (UCL – Average)/3 = (9.3 – 3.5)/3 = 1.9
The average ± one sigma is given by 2 to 5. NOAA is predicting 1 to 4 major hurricanes this year. This is a little lower than the 2 to 5 predicted based on ± one sigma.
Other References to Climate Based Articles
We have examined other climate-based data in our SPC Knowledge Base. We have 8 publications on global warming the latest one being
We also have video on SPC and global warming:
The link below examines tornadoes.
Summary
It is interesting that each chart shows the increase in hurricane activity since 1995. It appears that there have been periods of low and then activity as shown in Figures 2 and 3. An article on the NOAA website discusses this: Atlantic high-activity eras: What does it mean for hurricane season?.
This publication examined how control charts can be used to predict future values of things we can’t control – like the weather. The approach basically relies on finding periods of stability in the recent past and using that period to predict the future – within limits. The recent period must be in statistical control to make the prediction. The last 100 years of hurricane data were used in the analysis. The results matched well with the NOAA predictions for 2023 as shown in the table below.
| NOAA | Control Charts | |
| Tropical Storms | 12 to 17 | 12 to 20 |
| Hurricanes | 5 to 9 | 5 to 11 |
| Major Hurricanes | 1 to 4 | 2 to 5 |