August 2025

That is the challenge then. How do we approach data in a way that allows us all to reach the same conclusions? One problem is that we like to compare a result to a specification, an average, last quarter’s result, last year’s result and on and on. That way, it is easier to pick out the data that supports our position.
These binary methods of comparing results don’t tell us anything about the underlying process. There is only one way to do that – and it holds the key to reaching agreement on what the data tells us. And that way is through the use of control charts.
This publication explores how to do this with real-life messy data: crime in Washington, D.C. Can you imagine President Trump holding up a control chart to back up his statement that “crime in Washington, D.C., is totally out of control” or “murders in 2023 reached the highest rate, probably ever.” Or Mayor Muriel Bowser holds up a control chart that supports her statement that “we are not experiencing a spike in crime.”
It is hard to argue about what a control chart tells you.
In this publication:
Please feel free to leave a comment at the end of this publication. You can download a copy of this publication at this link.
Introduction
Control charts work just about everywhere. It is too bad that they are not used just about everywhere. There would be less disagreements about what the data tells you. When President Trump decided to send in the National Guard to help with crime in Washington, D.C., those in favor of this and those against cited data to back their positions. But rarely was there a run chart or, heaven forbid, a control chart to back up their claims. If everyone agreed we would use control charts to display our data and how we will interpret the control chart, we would have much more agreement on what the data is telling us.
So, let’s see what we can learn from using control charts to analyze the crime data.
Data
Finding good data is not always easy with topics like crime. I settled on Crime Data DC website, the official police-reported incidents. This website had data from 2013 to 2025 YTD. This gives over 10 years for control chart data. I also used some data from the Metropolitan Police Department (MPD). The latter had homicide data for the past 20 years plus recovered firearms data over time.
The data from the Crime Data DC website is shown in Table 1.
Table 1: Crime Data for Washington, D.C.
|
Offense |
2013 |
2014 |
2015 |
2016 |
2017 |
2018 |
|
Homicide |
104 |
105 |
160 |
136 |
116 |
160 |
|
Motor Vehicle Theft |
2,667 |
3,120 |
2,905 |
2,691 |
2,409 |
2,399 |
|
Assault w/Dangerous Weapon |
2,397 |
2,476 |
2,392 |
2,268 |
1,848 |
1,670 |
|
Theft/Other |
12,892 |
14,632 |
14,245 |
14,556 |
14,496 |
14,204 |
|
Theft from Auto |
10,181 |
11,339 |
11,298 |
12,167 |
10,275 |
11,638 |
|
Robbery |
3,987 |
3,280 |
3,346 |
2,980 |
2,177 |
2,027 |
|
Burglary |
3,358 |
3,185 |
2,541 |
2,123 |
1,532 |
1,417 |
|
Total |
35586 |
38137 |
36887 |
36921 |
32853 |
33515 |
|
Offense |
2019 |
2020 |
2021 |
2022 |
2023 |
2024 |
|
Homicide |
164 |
195 |
224 |
200 |
273 |
187 |
|
Motor Vehicle Theft |
2,186 |
3,258 |
3,477 |
3,739 |
6,773 |
5,126 |
|
Assault w/Dangerous Weapon |
1,571 |
1,632 |
1,660 |
1,381 |
1,399 |
1,027 |
|
Theft/Other |
15,570 |
10,927 |
10,895 |
10,774 |
13,243 |
12,968 |
|
Theft from Auto |
10,731 |
8,276 |
8,664 |
7,792 |
7,715 |
6,648 |
|
Robbery |
2,233 |
1,997 |
2,034 |
2,080 |
3,456 |
2,104 |
|
Burglary |
1,275 |
1,441 |
1,174 |
1,050 |
1,090 |
1,000 |
|
Total |
33730 |
27726 |
28128 |
27016 |
33949 |
29060 |
They also provide year-to-date information for 2025. As of August 26, 2025, 103 homicides, 3,051 motor vehicle thefts and 578 incidents of assault with a dangerous weapon have been reported. Additionally, there have been 7,590 theft incidents, 3,947 thefts from auto incidents while 931 robberies and 474 burglaries have also been reported. These are used to estimate 2025 totals. Table 2 lists the 2025 estimates.
Table 2: Washington, D.C. Crime Rate Estimates for 2025 (as of 8/26/2025)
|
Offense |
2025 Est. |
|
Homicide |
158 |
|
Motor Vehicle Theft |
4679 |
|
Assault w/Dangerous Weapon |
886 |
|
Theft/Other |
11640 |
|
Theft from Auto |
6053 |
|
Robbery |
1428 |
|
Burglary |
727 |
|
Total |
25571 |
Table 3 shows the number of homicides over the last 20 years from the MPD website. There are some minor differences with the DC Crime website, but it is messy data.
Table 3: Homicide Data for Washington, D.C. (MPD)
|
Year |
Number |
Year |
Number |
|
|
2024 |
187 |
2014 |
105 |
|
|
2023 |
274 |
2013 |
104 |
|
|
2022 |
203 |
2012 |
88 |
|
|
2021 |
226 |
2011 |
108 |
|
|
2020 |
198 |
2010 |
132 |
|
|
2019 |
166 |
2009 |
144 |
|
|
2018 |
160 |
2008 |
186 |
|
|
2017 |
116 |
2007 |
181 |
|
|
2016 |
135 |
2006 |
169 |
|
|
2015 |
162 |
2005 |
196 |
Table 4 shows the number of recovered firearms by year since 2015.
Table 4: Recovered Firearms in Washington, D.C. (MPD)
|
Year |
Recovered Firearms |
|
2015 |
1,706 |
|
2016 |
1,870 |
|
2017 |
2,191 |
|
2018 |
1,928 |
|
2019 |
2,299 |
|
2020 |
2,371 |
|
2021 |
2,310 |
|
2022 |
3,152 |
|
2023 |
3,135 |
|
2024 |
2,895 |
Now we have our data, and we know, at least, what websites it comes from. We are ready to use control charts to present the data. No comparisons between pair values are allowed from here out. We want to look at the data over time to see the underlying process.
Control Charts on Washington, D.C. Crime
Throughout our analysis, we will use individuals (X-mR) control charts. We will omit the moving range chart and just show the X chart. On an X chart, each individual result is plotted. The average is then calculated and added to the X chart. Control limits are then calculated from the average moving range. The control limits are then added to the X chart. Then you are ready to interpret what the X control chart is telling you about the process. For more information on individual control charts, please see our free SPC Knowledge Base. All the control charts shown in this publication were made using the SPC for Excel software.
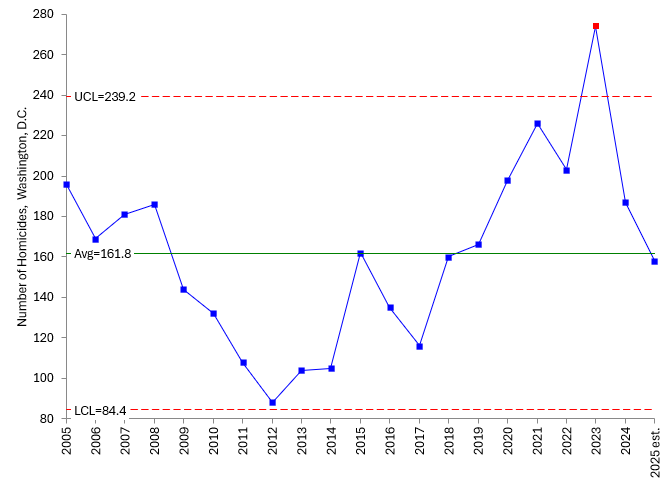
We will start by using the homicide data for the past 20 years shown in Table 3. The X chart for these data is shown in Figure 1. The average is 161.8 homicides with an LCL = 84.4 and an UCL = 239.2. This means, if the process is in control, you would expect homicides to range from about 84 to 239 with an average of 162 over time.
Figure 1: Homicides in Washington, D.C. (MPD)
Is the X chart in statistical control? If it was, there would be no points beyond the control limits and no patterns in the data. The X chart is not in statistical control.
The largest number of homicides occurred in 2023, confirming that 2023 was a record year for homicides as President Trump said. It is an out of control point on the chart, meaning it is an outlier when compared to the rest of the data. The lowest number occurred in 2012, but it is within the control limits. The X chart shows a downward trend at the start and then a trend upward starting in 2017.
You can’t use this chart to predict what will happen in the future. It is not consistent and predictable. So, does this confirm President Trump’s statement that the crime in Washington, D.C. is widely out of control? Well, the homicide chart is out of control, but that is just one part of the picture.
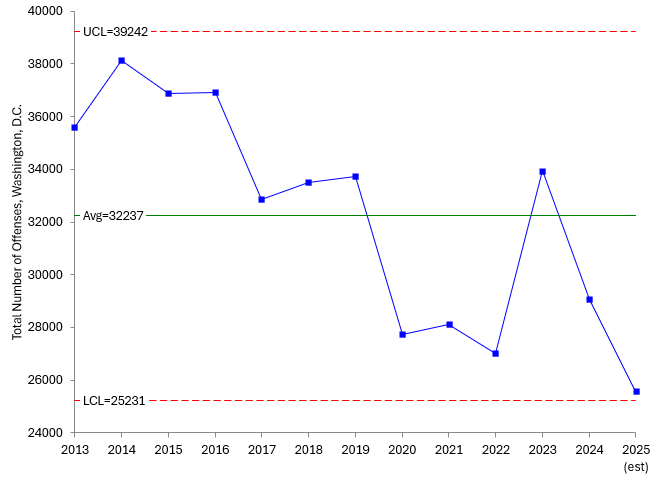
Let’s examine the total number of crimes, taken as the sum of the offenses listed in Table 1. The X chart for these data is shown in Figure 2.
Figure 2: Total Number of Offenses in Washington, D.C.
Is this X chart in statistical control? If we are looking only at points beyond the control limits, then the answer is yes. But we do have a pattern at the start of the chart – a downward trend until 2023. The last two years have been down again.
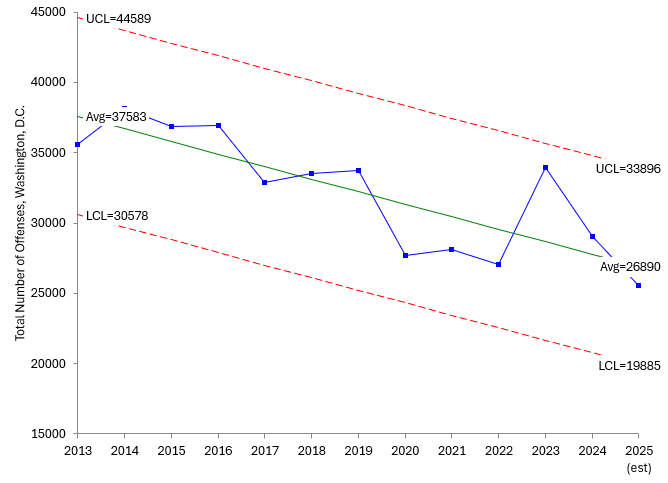
With data like this, you can sometimes use a trend control chart. The data is checked via regression to see if there is a trend. If there is a significant trend, the average on the X chart is replaced by the best fit equation. This was done for the data in Figure 2. The trend control chart for this data is shown in Figure 3.
Figure 3: Trend Control Chart for Total Number of Offenses in Washington, D.C.
This chart is in statistical control. It shows that there is a predictable downward trend in the total number of crimes. This seems to confirm Mayor Bowser saying that there is not a crime spike in Washington, D.C. In fact, there is a general downward trend in total crime.
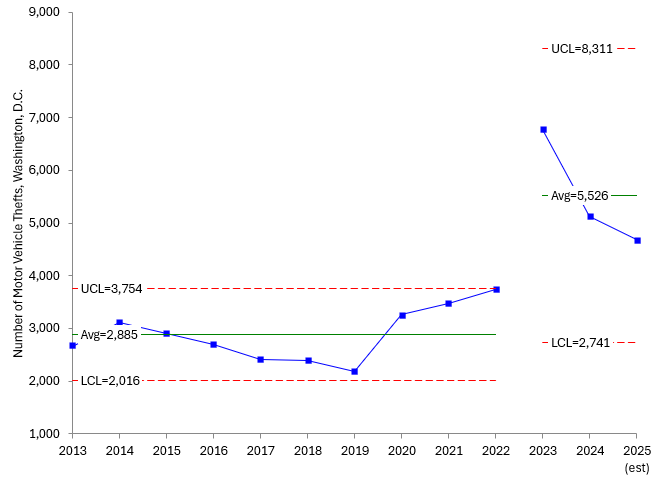
Now let’s see what the offenses in Table 1 look like starting with motor vehicle thefts. The remaining charts will have limited discussion. Some charts will show split control limits or trends.
Figure 4: Motor Vehicle Thefts in Washington, D.C.
This X chart really has two processes, one that is represented by 2013 – 2022 data. Then there was a sudden upturn in 2023 with almost twice as many thefts.
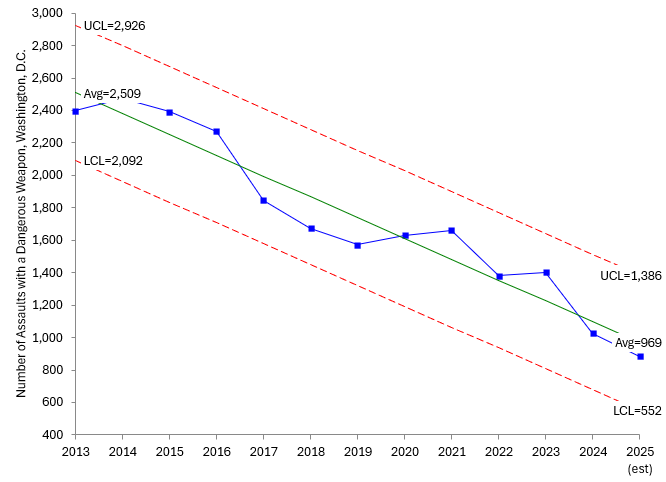
Figure 5 is the X chart for assault with a dangerous weapon. There is a clear downward trend in this metric.
Figure 5: Assault with a Dangerous Weapon in Washington, D.C.
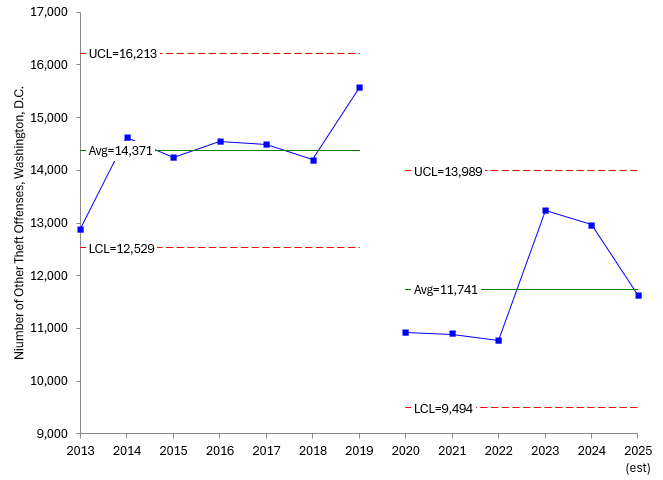
Figure 6 is the X chart for other theft.
Figure 6: Other Theft in Washington, D.C.
This chart shows two processes with a split occurring in 2020. Something happened to decrease the number of offenses due to theft other.
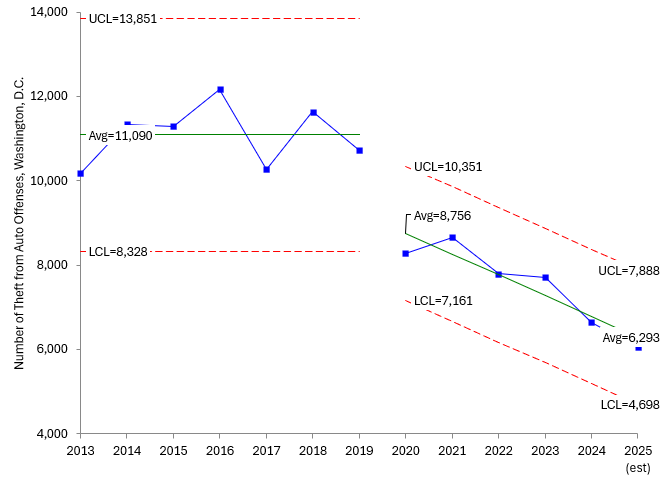
Figure 7: Theft from Auto in Washington, D.C.
This chart is in statistical control using a split control limit in 2020. Since 2020 there has been a downward trend.
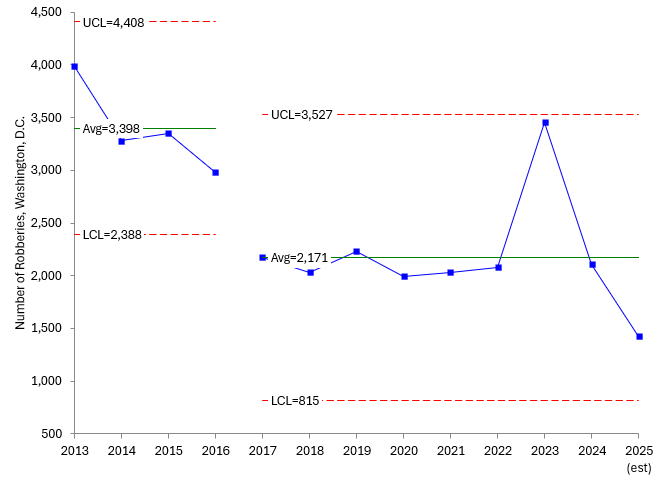
Figure 8: Robberies in Washington, D.C.
Robberies dropped significantly in 2017 and have leveled out since then; with some indication that a downward trend might be developing.
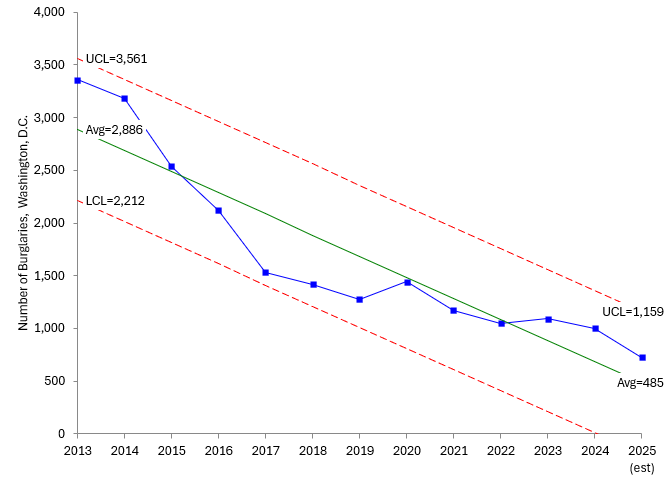
Figure 9: Burglaries in Washington, D.C.
This figure shows a definite downward trend in burglaries in Washington, D.C.
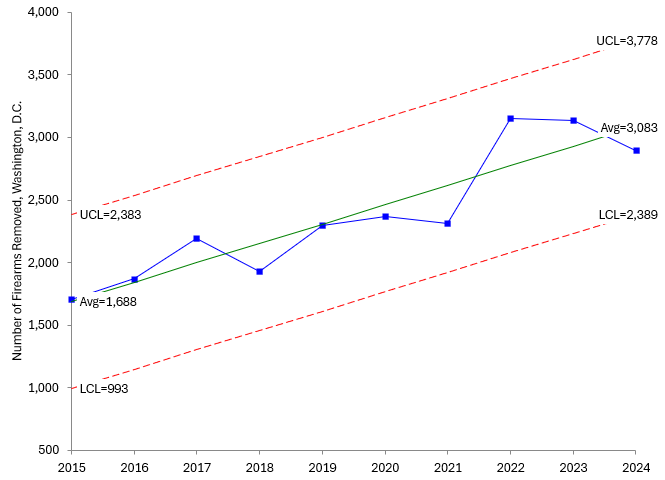
Figure 10: Removed Firearms per Year in Washington, D.C. (MPD)
This chart is in statistical control with an upward trend. There have been more and more firearms taken off the streets, but no telling how many are still out there.
Summary
We have looked at a lot of data, using control chart to try and see the underlying process. It is not easy at times. Is there a trend or not? Does it make sense to split the control limits?
What do all these charts tell us about crime in Washington, D.C.? First, there is a lot of it. This year it is projected to have 25,571 offenses. But the data shows that things are getting better each year in terms of total offenses.
Here is a summary of the results:
- Homicides: Out of control, point beyond the control limits in 2023
- Total offenses: In control, downward trend
- Motor Vehicle Theft: In control with split limits, increase in 2023
- Assault with Dangerous Weapon: In control, downward trend
- Theft/Other: In control with split limits, decrease in 2020
- Theft from Auto: In control with split limits, downward trend since 2020
- Robbery: In control with split limits, decrease in 2017
- Burglary: In control, downward trend
- Removed Firearms: In control, upward trend
There is a lot of analysis that could be done on this data. We have just scratched the surface. For example, has removing the firearms had an impact on assault with dangerous weapon. You would think so and could compare the two using a scatter diagram. How does Washington, D.C. compare to similar size cities in crime? You can go on and on in the data analysis to dig deeper.
What is the bottom line? What President Trump said is true about the homicides being out of control. You can’t focus on just one point. You have to consider the process over time. What Mayor Bowser said about there not being a spike is true based on the data analyzed here. Most the metrics were in control, although you have to use trends and split control limits to see what is happening. Messy data for sure.
If a process is in control, you have to fundamentally change it to improve the results. Figure 3 shows the total offenses to be in statistical control with a downward trend. To improve that process would require changing the process to reduce the number of offenses more quickly than Figure 3 shows. Sending in then National Guard is definitely changing the process. Will it work? Will there be a negative impact? Time will show – as will the data.
