March 2014

We have developed an interactive Excel workbook that lets you visually see how changing the average and standard deviation of your process impacts your process capability. You will be able to see visually how the process shifts versus your specifications. In addition, the workbook shows how Cp, Cpk, the sigma level, and the ppm out of specification change. You can download the workbook for your own use.
Many folks just calculate a process capability value each month or for each lot – not realizing that a change in the value of the process capability may be simply due to common causes of variation. In the end though, it is your customer who decides how important process capability is to you. For many customers, this is their only way of “judging” how well your process meets their specifications – even with all the caveats that go along with calculating the process capability. Like it or not, process capability calculations are here to stay.
So, this month, we provide you with a visual method of seeing how process capability changes as the average, standard deviation and specifications change. You can use the interactive workbook to help you see these changes or to help explain the impact of these changes to others. Hope you enjoy the interactive workbook.
In this issue:
- A review of process capability: Cp and Cpk
- What happens as the process standard deviation changes
- What happens as the process average shifts
- Summary
- Quick links
You may download a pdf copy of this publication at this link.
A Review of Process Capability: Cp and Cpk
We will briefly review two process capability indices here: Cp and Cpk. For more information on these (and on Pp and Ppk), please see our three-part series on process capability in our SPC Knowledge Base. Process capability answers the question of how well our process meets our customer’s specifications. We will use LSL and USL for the lower and upper specification limits, respectively.
Remember, the process capability indices calculations require that your process be in statistical control and that the individual measurements are normally distributed.

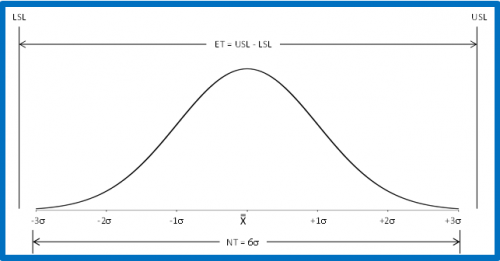
Cp= ET /NT = (USL-LSL) /6σ
where s is the process standard deviation estimated from a range control chart. Note that s is not the calculated standard deviation. The visual presentation of Cp is shown in Figure 1.
Figure 1: Cp Index
For Cp:
- If the engineering tolerance is less than the natural tolerance (i.e., Cp < 1.0), the process is not capable of meeting specifications.
- If the engineering tolerance is equal to or larger than the natural tolerance (Cp > 1.0), the process is capable of meeting specifications.
However, a process can be capable of meeting specifications but not be meeting specifications if the process is not centered relative to the specifications. In fact, you can have a value of Cp > 1.0 and everything be out of specifications if the process operates completely outside the specification limits.

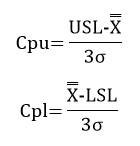
Cpk takes into account where the process is centered. The value of Cpk is the minimum of two process capability indices. One process capability is Cpu, which is the process capability based on the upper specification limit. The other is Cpl, which is the process capability based on the lower specification limit. Algebraically, Cpk is defined as:
Cpk = Minimum (Cpu, Cpl)
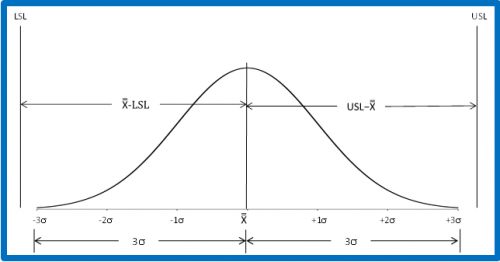
Figure 2 shows how the Cpk values are calculated. For the area below the average, it can be seen that the Cpl is simply the ratio of the process average minus LSL to 3s. If that ratio is greater than one, the LSL is more than 3s from the average. Likewise, Cpu is simply the ratio of USL minus the process average to 3s. If that ratio is greater than one, the USL is more than 3s from the average. Cpk is the minimum of Cpu and Cpl. So, if Cpk is greater than 1, then no product is being produced out of specification on the high or low side. Yes, there is a small percentage of the normal curve outside +/- 3s. This is why more and more customers are demanding higher Cpk values, e.g., 1.33.
Figure 2: Cpk Index
If there is only one specification, the value of Cpk is either Cpu or Cpl, whichever is appropriate for the specification. So, if there is only an USL, then Cpk = Cpu. Likewise, if there is only a LSL, the Cpk = Cpl.
What Happens as the Process Standard Deviation Changes?

- Average = 0
- Standard deviation = 1
- Lower specification limit = -3
- Upper specification limit = 3
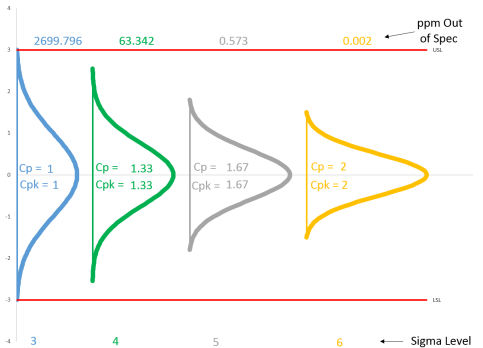
When you enter these into the workbook, the chart below is updated to reflect the values entered.
Figure 3: Impact of Decreasing Variation for Centered Process
There are four normal curves on the chart. The average and specification limits are the same for each of the curves. What changes is the standard deviation. The first normal curve (blue) has the standard deviation entered, in this case 1. In the second normal curve (green), the standard deviation has been decreased by a factor of ¾. In the third normal curve (gray), the standard deviation has been decreased by a factor of 3/5. In the fourth normal curve, the standard deviation has been decreased by a factor of ½.
Four values are also given for each curve: Cp, Cpk, sigma level and ppm out of spec. Cp and Cpk are calculated using the formula above. Sigma level is simply equal to 3Cpk. The ppm out of specification is calculated using the NORMSDIST function in Excel. You can see the formulas used by examining the worksheets in the interactive workbook.

The standard deviation in the second curve has decreased from 1 to 0.75. What has happened to the curve? It is narrower since the standard deviation is smaller. Note that Cp = Cpk = 1.33. The sigma level is now 4 – the specification limits are now four standard deviations away from the average. The out of specification has decreased from 2700 to about 63 ppm.
The standard deviation in the third curve has decreased further – to 0.6. The curve is narrower again. Cp = Cpk = 1.67. The sigma level is now 5 – the specifications are five standard deviations away from the average. The out of specification has decreased to 0.57 ppm.
The fourth curve represents that magical 6 sigma level. The standard deviation is now 0.5 and Cp = Cpk = 2. The sigma level is 6 – the specifications are six standard deviations away from the average and the out of specification is now 0.002 ppm.
So by decreasing the standard deviation by a factor of 2 for this example, the ppm out of specification dropped from 2700 to 0.002.
In addition, the interactive workbook contains a table with the detailed results. The table for this example is shown below.
Table 1: Results for Average = 0, USL = 3, LSL = -3
| Sigma | 1 | 0.75 | 0.6 | 0.5 |
| Cp | 1 | 1.33 | 1.67 | 2 |
| Cpu | 1 | 1.33 | 1.67 | 2 |
| Cpl | 1 | 1.33 | 1.67 | 2 |
| Cpk | 1 | 1.33 | 1.67 | 2 |
| Out of Spec LSL (ppm) | 1350 | 32 | 0.29 | 0.001 |
| Out of Spec USL (ppm) | 1350 | 32 | 0.29 | 0.001 |
| Total Out of Spec (ppm) | 2700 | 63 | 0.57 | 0.002 |
| Sigma Level | 3 | 4 | 5 | 6 |

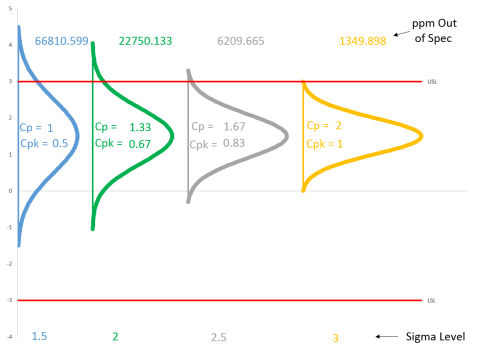
Cpk and the sigma level have decreased while the ppm out of specification has increased significantly. Note that the sigma level for the fourth curve is 3. This is the curve that had the 6 sigma level before the shift. So, even with a large shift in the average, the 6 sigma level process still is producing most of the product within specifications. The table of results for the data in Figure 4 is given in Table 2.
We will not show what happens when you change specifications here. You can experiment with that in the interactive workbook.
Figure 4: Process Shift from 0 to 1.5
Table 2: Results from 1.5 Shift in Average
| Sigma | 1 | 0.75 | 0.6 | 0.5 |
| Cp | 1 | 1.33 | 1.67 | 2 |
| Cpu | 0.5 | 0.67 | 0.83 | 1 |
| Cpl | 1.5 | 2.00 | 2.50 | 3 |
| Cpk | 0.5 | 0.67 | 0.83 | 1 |
| Out of Spec LSL (ppm) | 3 | 0 | 0.00 | 0.000 |
| Out of Spec USL (ppm) | 66807 | 22750 | 6210 | 1350 |
| Total Out of Spec (ppm) | 66811 | 22750 | 6210 | 1350 |
| Sigma Level | 1.5 | 2 | 2.5 | 3 |
What Happens as the Process Average Shifts?

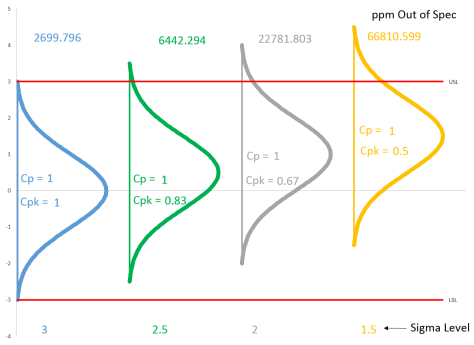
Figure 5 shows the results with the same starting point as Figure 3 (average = 0, standard deviation = 1, USL = 3, LSL = -3). Note that the first normal curve is the same on both charts.
Figure 5: Shifting Average, Same Standard Deviation
As the average moves closer to the specification limit, Cpk and sigma level decrease as the ppm out of specification increases. The tabular results are shown below.
Table 3: Results for Shifting Average, Same Standard Deviation
| Average | 0 | 0.5 | 1 | 1.5 |
| Cp | 1 | 1 | 1 | 1 |
| Cpu | 1 | 0.83 | 0.67 | 0.5 |
| Cpl | 1 | 1.17 | 1.33 | 1.5 |
| Cpk | 1 | 0.83 | 0.67 | 0.5 |
| Out of Spec LSL (ppm) | 1350 | 233 | 32 | 3 |
| Out of Spec USL (ppm) | 1350 | 6210 | 22750 | 66807 |
| Total Out of Spec (ppm) | 2700 | 6442 | 22782 | 66811 |
| Sigma Level | 3 | 2.5 | 2 | 1.5 |
We will leave it up to you to explore other situations using the interactive workbook.
Summary
This publication presented a brief review of process capability and then introduced an interactive Excel workbook that allows you to see the impact of changing the process average, process standard deviation, or specification limits on process capability. The interactive workbook looks at two different situations:
- Constant average, changing standard deviation
- Constant standard deviation, changing average
The interactive workbook contains a visual picture of how the process capability changes as well as tabular results.
You can download the interactive workbook here. We hope you find it useful. Please feel free to give us suggestions on how to improve it.
This article is extremely helpful. Thanks a lot for writing this article. It answered almost all doubts I had on process capability. Remaining doubts I am writing here: how you calculate ppm out of spec for diff. Sigma levels. In above artical table no 2 for sigma level 1.5 there is out of spec lsl ppm is 3 and for usl ppm is 66807. I want to know how you calculate this???
Thank you. In Excel you can calculate the ppm above the USL as:
1000000* (1 – NormSDist((USL- Avg)) / Sigma))
Similar for LSL.
Hi, can i have step by step method how the cpk requirement set as 1.33
Hello,
I am not sure what you mean. You can set the Cpk requirement to anything. Common one is 1.33, which sets the specification 4 sigma from the average.
Hi,Can u explain difference between sigma and sigma level
Sigma level is a measure of process capability: the higher the process sigma, the more capable the process is. Sigma is an estimate of the standard deviation of the process.
Hi,this excel formula u have given is working only for sigma value= 1, for less than 1 its showing ppm more than lakhs.
Not sure what you are saying. Lakhs?
I work in retail distribution. We're interested in using SPC for measuring whether our warehouse processes are in control or not. Any advice for using these concepts for a physical movement of goods vs tolerance for a manufactured item? Would appreciate any guidance.
Please see this article:
https://www.spcforexcel.com/knowledge/control-chart-examples/spc-process-improvement-warehouse
I spent a lot of time applying SPC in distribution. Works great!
Hello,6 sigma level with 1.5sigma should be 4.5 sigma level, right? why it becomes 3 sigma level? can you pzl explain, thxBRWen
I am not sure what you are asking. Please give me more information.
Hi…Had a doubt on what is the difference between six sigma and process capability index
A six sigma process (3.4 defects per million) has a Cpk value of 2.0.
Can you please provide password, to learn the equiations used, will be very helpful. Thanks.
There is no password. You can see the equations by unhiding the sheets.
please share calculation – how sigma value (e.g.1.33) is derived.
Do you mean Cpk? The equations are in the article. Sigmal level is 3*Cpk
When we graph the cpk value of 1.33, we can see that there is no non-conforming. however, cpk of 1.33 is 4 sigma level equating to a potential defect of 63 ppm. how is that possible?
Are you asking how a Cpk 1.33 can have 63defects? There normal curve never reaches the 0 point. There will always be defects at some level.