December 2020
(Note: all the previous SPC Knowledge Base in the process capability category are listed on the right-hand side. Select this link for information on the SPC for Excel software.)
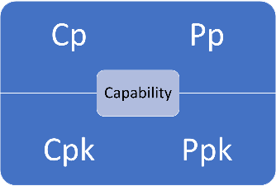
This month’s publication takes a deeper look at these four process capability/performance metrics. It explains why you have a good idea if your process is in statistical control and if it is operating near the center point of the specifications without even charting the data! You will see that the following are true:
- If the Cp and Pp metrics are essentially the same, the process is operating the best it can since the process is in statistical control.
- If the Cp and Pp metrics are not the same, the process is out of statistical control.
- If all four metrics are essentially the same, the process is operating the best it can since the process is in statistical control and the process is operating at the center point of the specifications.
- If the metrics Cp and Pp are different from their counterparts, Cpk and Ppk, the process is not operating at the center of the specifications.
- If all four metrics are different, the process is out of statistical control and is not operating at the center point of the specifications.
In this issue:
- Introduction
- Cp: Capability Ratio
- Pp: Performance Ratio
- Cpk: Capability Ratio Taking into Account Process Centering
- Ppk: Performance Ratio Taking into Account Process Centering
- Is There Short- and Long-Term Capability?
- Stable Process Example
- Unstable Process Example
- Summary
- Quick Links
You may download a pdf copy of this publication at this link. Please feel free to leave a comment at the end of the publication.
Introduction
Process capability/performance deals with the ability of a process to meet specifications. The ratios are used to measure capability/performance and are defined by two things:
- The room available for the process to operate – this is defined by the specifications.
- The room the process needs to operate – this is defined by the process variation.
All four metrics are ratios, in one form or another, of the room available based on the specifications to the room the process needs to operate based on the process variation.
Dr. Donald Wheeler’s paper “The Problem with Long Term Capability” defined four components that make it possible to calculate the ratios. The first two components are based on the specifications:
1. The difference between the upper specification limit (USL) and lower specification limit (LSL) defines the total room the process has to operate.
2. If the process is not centered, the room a process has to operate is decreased because one specification limit is closer to the average than the other specification limit.
The second two components are based on the process variation:
3. Sigma (σ) is a measure of the process variation obtained from a range control chart.
4. The standard deviation (s) is a measure of the process variation obtained from using all the data in the past.
The four ratios are introduced below and shown how they relate to the components above.
Cp: Capability Ratio
The value of Cp is given by the following:
Cp = (USL-LSL)/6σ
The average range is used to estimate σ. For example, for an individuals control chart the average moving range is based on the range between consecutive values. For an X-R chart, the average range is based on the range within a subgroup (for example, a subgroup of four consecutive values).
The difference in the specifications represents the Engineering Tolerance (ET). This is the total room available for the process to operate within the specifications. This is component 1 from above.
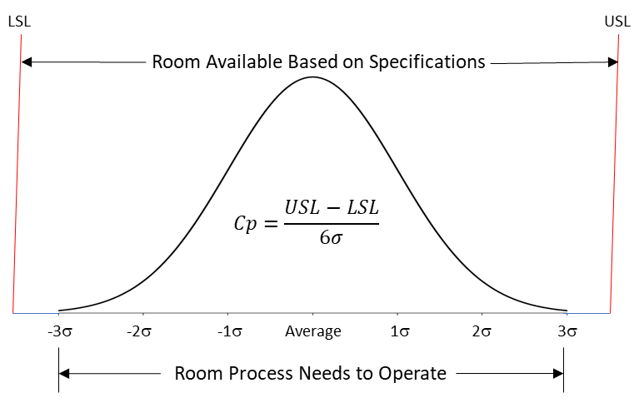
6σ is the natural tolerance of the process. This is component 3 from above. It represents the room required by the process to operate when the process is in statistical control. If a process is in statistical control, it is operating at its full potential for the current process. Figure 1 shows the concept behind Cp.
Figure 1: Cp Capability Ratio
So, Cp is the room available based on the specifications divided by the room needed for the process to operate. If Cp is greater than 1, then the room available is greater than the room the process needs to operate. The potential is there for everything to be within specifications. However, that depends on where the process is centered.
Pp: Performance Ratio
The value of Pp is given by the following:
Pp=(USL-LSL)/6s
where s is the calculated standard deviation using all the data. Note that the only difference between Cp and Pp is how the process variation is calculated. The calculated standard deviation includes all the past data and does not take into account if the process is in statistical control. If the process is not in statistical control, the value of the calculated standard deviation will often be inflated. The value of 6s is component 4 from above. It represents the room the process has required in the past to operate.
So, Pp is the room available based on the specifications divided by the room needed for the process to operate based on past performance.
Cpk: Capability Ratio Taking into Account Process Centering
One issue with Cp and Pp is that neither takes into account where the process is centered. Cp and Pp can be greater than 1 but it is possible that nothing is within specifications if the process is centered and operates completely outside the specification range.
Cpk is the capability index that takes into account where the process is centered:
Cpk = Minimum (Cpu, Cpl)
Cpu=(USL-Average)/3σ
Cpl=(Average-LSL)/3σ
where “Average” is the overall average of the X values, Cpu is the capability based on the upper specification limit and Cpl is the capability based on the lower specification limit. Since Cpk is the minimum of Cpu and Cpl, the specification closest to the average determines the value of Cpk. This is component 2 from above. Note that Cpk uses σ as the measure of variation (component 3 from above). The Cpk concept is shown in Figure 2.
Figure 2: Cpk
Cpk is the ratio of the room available based on the specification closest to the average and the room the process needs to operate when the process is in statistical control.
Ppk: Performance Ratio Taking into Account Process Centering
Ppk is defined as the following:
Ppk = Minimum (Ppu, Ppl)
Ppu=(USL-Average)/3s
Ppl=(Average-LSL)/3s
Note, like Cp and Pp, the only difference between Cpk and Ppk is the use of the calculated standard deviation (s) instead of σ. Again, the specification closest to the average determines Cpk (component 2 from above). The ratio this time involves the process variation based on the calculated standard deviation (component 4).
Ppk is the ratio of the room available based on the specification closest to the average and the room the process needs to operate based on the past data.
Is There Short- and Long-Term Capability?
Sometimes you hear the terms short-term and long-term capability. Some call Cpk the short-term capability and Ppk the long-term capability. I have probably done this over the years, most likely because Cpk is based on σ, the short-term variation if you think about it in terms of how sigma is calculated using the within variation. Ppk is based on the calculated standard deviation that takes all the data over time.
However, there is really not a short-term capability and a long-term capability. There are only two types of capability:
A capability estimated by using the range control chart and the within variation.
A capability estimated by overall variation – the calculated standard deviation.
If the process is in statistical control, it is operating at its optimum – and the two capability indices (Cp and Pp) will be the same. In fact, for a process that is in statistical control, the Pp value may be greater than the Cp value sometimes. But in the long-term, both are the same.
Stable Process Example
Table 1 contains data that was randomly generated for a normal distribution with an average of 100 and a standard deviation of 10.
Table 1: Example Data for a Stable Process
| Sample | X | Sample | X | |
|---|---|---|---|---|
| 1 | 86.50 | 26 | 108.58 | |
| 2 | 105.80 | 27 | 93.02 | |
| 3 | 99.97 | 28 | 104.21 | |
| 4 | 95.45 | 29 | 89.00 | |
| 5 | 105.49 | 30 | 93.23 | |
| 6 | 100.78 | 31 | 90.63 | |
| 7 | 108.34 | 32 | 97.43 | |
| 8 | 111.12 | 33 | 99.00 | |
| 9 | 104.28 | 34 | 106.57 | |
| 10 | 104.10 | 35 | 89.93 | |
| 11 | 97.81 | 36 | 91.04 | |
| 12 | 89.65 | 37 | 96.59 | |
| 13 | 104.50 | 38 | 101.42 | |
| 14 | 87.39 | 39 | 98.90 | |
| 15 | 96.02 | 40 | 79.91 | |
| 16 | 103.07 | 41 | 95.43 | |
| 17 | 93.69 | 42 | 104.80 | |
| 18 | 102.51 | 43 | 85.36 | |
| 19 | 95.54 | 44 | 98.53 | |
| 20 | 97.64 | 45 | 95.66 | |
| 21 | 113.09 | 46 | 88.69 | |
| 22 | 104.58 | 47 | 106.37 | |
| 23 | 103.24 | 48 | 113.49 | |
| 24 | 100.24 | 49 | 114.19 | |
| 25 | 110.89 | 50 | 112.27 |
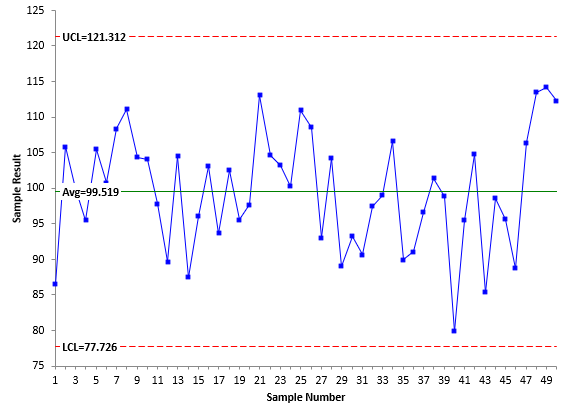
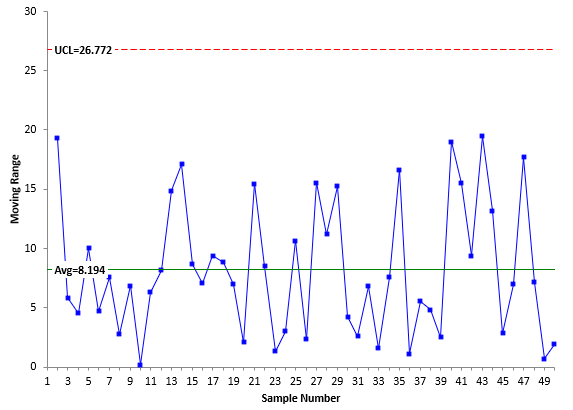
The data in Table 1 were analyzed using an individuals (X-mR) control chart. The X and mR charts are shown in Figures 3 and 4, respectively.
Figure 3: X Chart for Stable Process
Figure 4: mR Chart for Stable Process
The individual values are plotted on the X chart while the moving range values are plotted on the mR chart. The moving range is the range between consecutive points. The first moving range is the range between the first two X values: 86.50 and 105.80. The first moving range is then 19.3. Both charts are in statistical control. There are no points beyond the control limits and no patterns.
Sigma is estimated from the average moving range (8.194) using the following:
σ=R/1.128=8.194/1.128=7.26
The 1.128 is a constant used with a moving range of 2. The calculated standard deviation (s) of all the data is s = 8.11. This is close to σ as expected since the process is in statistical control.
Assume that the specifications for the process are LSL = 75 and USL = 125. The average for the process from Figure 3 is 99.519. This is very close to the center of the specifications (100). It is slightly below the center of the specifications, so the LSL is closest to the average. The four indices are calculated as:
Cp=(USL-LSL)/6σ= 50/6(7.26) =1.15
Pp=(USL-LSL)/6s= 50/6(8.11) =1.03
Cpk= Cpl=(Average-LSL)/3σ= (99.519-75)/(3(7.26))=1.12
Ppk= Ppl=(Average-LSL)/3s= (99.519-75)/(3(8.11))=1.01
Remember that these indices compare the room the process needs to operate with the room the specifications allow. All are similar here because the process is in statistical control. This is an important point. If the four metrics give very similar results, the process will be close to the center of the specifications and will be in statistical control. You do not even need to make the control charts – although I think it is always good to have those charts.
Unstable Process Example
Now consider the case where the process is not stable. It is changing over time. Data for this process are given in Table 2. The specifications for this process are LSL = 90 and USL = 110.
Table 2: Unstable Process Data
| Sample | X | Sample | X | |
|---|---|---|---|---|
| 1 | 90.5 | 26 | 97.0 | |
| 2 | 93.0 | 27 | 94.0 | |
| 3 | 86.5 | 28 | 97.5 | |
| 4 | 89.5 | 29 | 100.0 | |
| 5 | 90.5 | 30 | 103.5 | |
| 6 | 88.5 | 31 | 102.0 | |
| 7 | 89.0 | 32 | 98.5 | |
| 8 | 93.0 | 33 | 96.0 | |
| 9 | 91.5 | 34 | 94.5 | |
| 10 | 91.0 | 35 | 96.8 | |
| 11 | 92.0 | 36 | 94.0 | |
| 12 | 91.5 | 37 | 90.0 | |
| 13 | 92.5 | 38 | 92.0 | |
| 14 | 86.0 | 39 | 98.0 | |
| 15 | 90.5 | 40 | 95.0 | |
| 16 | 92.5 | 41 | 95.5 | |
| 17 | 92.5 | 42 | 97.0 | |
| 18 | 90.5 | 43 | 97.0 | |
| 19 | 91.5 | 44 | 103.5 | |
| 20 | 93.0 | 45 | 104.0 | |
| 21 | 89.0 | 46 | 100.0 | |
| 22 | 94.0 | 47 | 100.0 | |
| 23 | 86.0 | 48 | 99.0 | |
| 24 | 87.5 | 49 | 100.0 | |
| 25 | 98.5 | 50 | 95.0 |
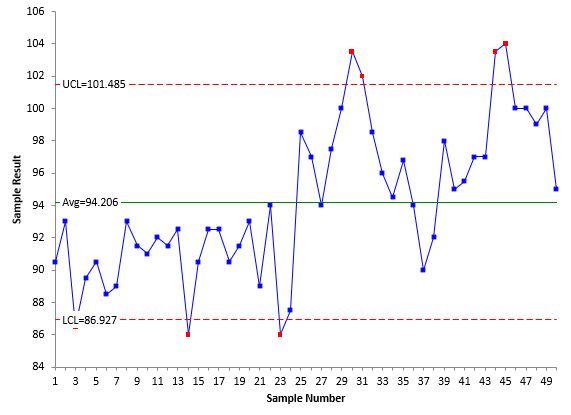
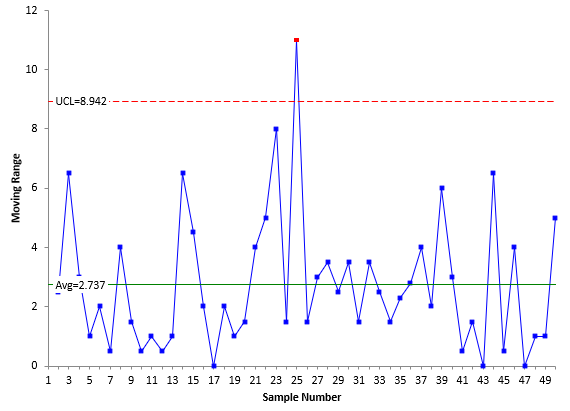
Figures 5 and 6 are the X and mR control charts for the data in Table 2.
Figure 5: X Chart for Unstable Process
Figure 6: mR Chart for Unstable Process
It is easy to see that the process is changing over time and not in statistical control from the two control charts. Sigma is estimated from the average moving range (2.737) as before:
σ=R/1.128=2.737/1.128=2.43
The calculated standard deviation (s) of all the data is s = 4.65. This is significantly more than σ as you would expect since the process is unstable. The overall average of the process from Figure 5 is 94.206. Note that this is not near the center of the specifications (100). The LSL is closer to the average than the USL, so the LSL determines the values of Cpk and Ppk. The four indices are then calculated as:
Cp=(USL-LSL)/6σ= 20/6(2.43) =1.37
Pp=(USL-LSL)/6s= 20/6(4.65) =0.72
Cpk= Cpl=(Average-LSL)/3σ= (94.206-90)/(3(2.43))=0.58
Ppk= Ppl=(Average-LSL)/3s= (94.206-90)/3(4.65) =.30
These four results are quite different. There is a big difference between Cp and Pp. This is due to the process being unstable and inflating the value of the calculated standard deviation. You know the process is out of control even without a control chart. There is a large difference between Cp and Cpk and between Pp and Ppk. This is due to the process being operated off-center.
Summary
This publication examined what Cp, Pp, Cpk and Ppk are actually measuring. These represent ratios of the room available based on the specifications to the room needed for the process to operate. Comparing these metrics will let you know if the process is in statistical control and/or operating at the center of the specifications.

Best article about process capability I've ever read; thank you Bill! Despite using process capability metrics for several years, I finally understand why Cp and Cpk use sigma (as calculated from the average range) for variation, and why Pp and Ppk use s, the historical standard deviation. After reading this article, the light came on. I feel chagrined that I didn't get this before. The numerical examples provided terrific clarification to send this point home.Thank you again for posting these articles each month, which have been enormously helpful. I always make sure I read each one.
Thank you very much for the kind comments!
Fantastic paper. Thank you for simplifying the learning process. I finally understand SPC 100%
Best explaination of all the four metrices in the most simplest way, I've ever come across. Thank You very much.
How does a quality engineer or a cad designer decide which dimension to CpK, is there a criteria?
I would say it is usually the dimensions critical to the customer.
I have read many books on process capability because i couldnt really connect many of the bits and pieces i was getting from the other materials. This article has enlightened and helped me understand the fundamental principle for the concepts. Especially how to determine the short term and the long term and apply relevant calculations. This will be of great help in my Lean Six Sigma course. Thank you!