January 2014
Affinity diagrams – I never believed that I would find them fun to make. After all, I think statistical process control (SPC) is great – looking at data, finding the information contained in that data about my processes – very little better than that! Yet, there comes a time when we have to face the facts – creative tools are a necessary part of problem solving and improvement. We can’t always do it with data alone. This month’s publication takes a look at one of those creative tools – the Affinity Diagram.
An Affinity Diagram provides a great way of generating a large number of ideas or opinions about an issue that is very large or complex. For example, deciding how to implement Six Sigma in an organization is not a simple task. The Affinity Diagram offers a way to quickly shift through the myriad of ideas and opinions in a very efficient way. In this issue, we will answer the following questions:
Of course, we still have our summary and quick links! Please feel free to leave a comment at the end of the publication.
You may download a pdf copy of this publication at this link.
What is an Affinity Diagram?
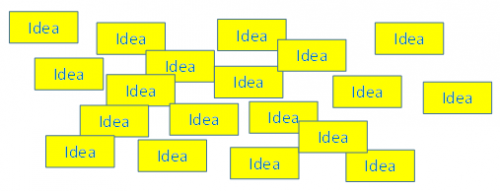
An Affinity Diagram is a tool that helps you organize lots of ideas in a very efficient manner – and in a short timeframe. Think about how many ideas you can generate about a complex subject. Maybe 50 – maybe more. You may have the ideas listed on several pieces of flip chart paper. Now what do you do with all these ideas? Some ideas are similar while others stand alone. What a mess!
Figure 1: Brainstormed List of Ideas
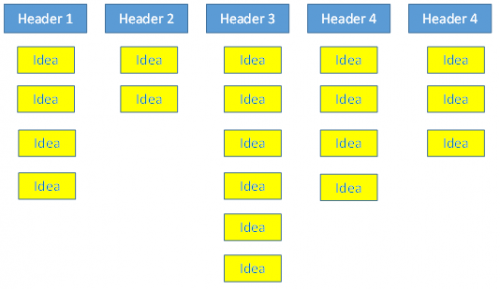
What the Affinity Diagram does is to help you organize all these ideas into natural groups as shown below. The Affinity Diagram is developed in a team setting. The process used helps ensure that all team members’ skills are utilized. The end result is a logical layout of the ideas – however, the process used is really a creative one – one that involves “silent brainstorming” and “no talking.”
Figure 2: Affinity Diagram Places Ideas into Natural Groups
The Affinity Diagram is one of the so-called Seven Management and Planning Tools. The seven techniques are:
-
Affinity Diagram
-
Interrelationship Digraph
-
Tree Diagram
-
Prioritization Matrices
-
Matrix Diagram
-
Process Decision Program Chart
-
Activity Network Diagram
A great resource for all these tools is the Memory Jogger Plus by Michael Brassard. According to this reference, the Affinity Diagram was developed by a Japanese anthropologist, Jiro Kawakita. He found that this approach helped him keep from falling back into his own paradigms and theories about the way societies and social institutions were supposed to be. Using the affinity diagram allowed him to find new patterns in the data.
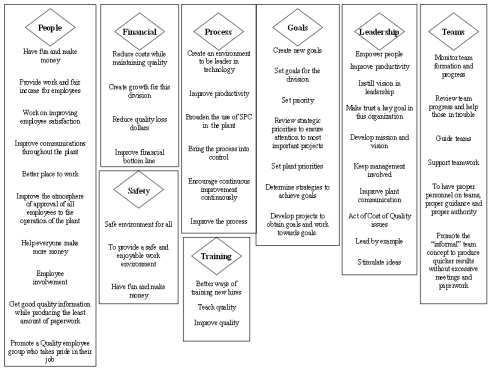
An example of an affinity diagram is shown in Figure 3. This affinity diagram addresses what a quality leadership steering committee in a manufacturing plant wants to accomplish in the coming year. Click on the figure for a larger version.
Figure 3: Affinity Diagram for Quality Leadership Steering Committee Goals
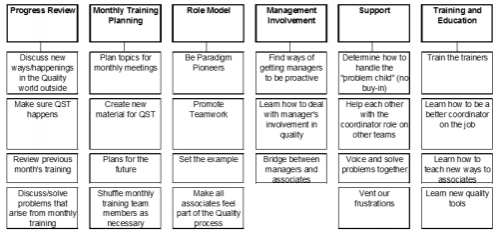
Figure 4 shows a partial Affinity Diagram on goals for a coordinator group assisting in implementing process improvement. Click on the figure for a larger version.
Figure 4: Process Improvement Coordinator Goals
When Should I Use an Affinity Diagram?
The examples Figure 3 and Figure 4 show how the Affinity Diagram can be used to find out what needs to happen to accomplish goals. Affinity Diagrams allow you to “get your arms around” complex issues. Affinity Diagrams also help you look at things in a new way. For example, you might want to tackle barriers to getting products to the customer on-time.
Anytime you plan on implementing something new, e.g., introducing a new product line, the Affinity Diagram offers you a way to ensure that you have considered everything. The more complex the issue, the more applicable the Affinity Diagram is.
How Do I Develop an Affinity Diagram?
The steps in developing an Affinity Diagram are given below. You will need Post-it Notes, flip chart paper and markers.
1. Put together a team to develop the affinity diagram.
The team should have at least 5 to 6 people. And the people need to have knowledge about the issue. If not, there is no way to dig deep into the issue.
2. Define the issue for the Affinity Diagram.
Tape two pieces of flip chart paper together and to the wall. This gives you more space to work. Write the issue at the top of the flip chart paper. Do not be detailed in writing down the issue. The shorter and more vague the issue, the better. For example, the issue could be Six Sigma Implementation, Plant Safety, or 2014 Human Resources Goals. Do not spend time talking about what the issue means. This tends to add judgment into the mix.
3. Brainstorm Ideas.

In silent brainstorming, each person writes down his/her idea on a Post-it note. There should be one idea per Post-it note. Once everyone has completed their brainstorming onto the Post-it notes, ask everyone to take their notes and place them in random order on the flip charts. This means that a person should not leave his/her ideas on one part of the flip chart – instead, spread them around on the flip chart.
For the verbal brainstorming, each person says his/her idea and writes it down on a Post-it note. Be sure to follow the rules of brainstorming – in particular, no discussion or judging ideas during the brainstorming session. After writing his/her idea down, the person places it randomly on the flip chart paper.
The challenge for team members, regardless of the brainstorming approach, is to try to be as concise as possible with each idea. This usually means that the idea needs 5 to 7 words.
Try to avoid ideas like “be safer.” A better idea would be “paint pedestrian walkways in production area.”
At the end of this step, the Post-it notes should be on the flip chart in random order. At this point, you can always mix them up more if needed.
4. Place the Cards into Groups.

Ask team members to find Post-it notes that are similar and move them into the same column. If someone disagrees with what another person does, he/she can move the Post-it notes again. Don’t worry. This will not go on forever. Continue to put the Post-it notes into similar columns until everyone agrees with the grouping of the Post-it notes.
There will typically be 6 to 10 groupings. It is fine to have a grouping with a single Post-it note under it. The tendency is to try to force fit it into one of the other groupings, but if it is really unique, then leave it by itself.
Be sure that everyone participates in this grouping. Sometimes one or two people tend to dominate this step. It is important that everyone provide their perspective on the grouping of the Post-it notes.
This whole process does not take very long once it starts. In fact, it is better not to over-analyze the groupings.
5. Develop the Headings.
Now you can talk. In this step, a heading is added to each column. This heading reflects the major idea of the Post-it notes in the column. For example, if one column contains safety ideas, a natural heading would be “Plant Safety.” As you go through this step, it is possible that a new column may be created or a couple of Post-it notes move from one column to another as people discuss what they meant by their ideas.
6. Tidy Up the Affinity Diagram.
You finish up the Affinity Diagram by drawing lines around each column and connecting the column with its heading with a line. Tape the Post-it notes to the paper to ensure the Post-it notes do not fall off.
How Do I Use an Affinity Diagram?
You have finished the Affinity Diagram. Now what? That depends on why you started the Affinity Diagram. And you will need to do something. In most cases, it will involve more work and analysis.
For example, if you were using an Affinity Diagram to develop goals, you will need to develop well-written goals for each key heading. The team can help you do this.
If you were using the Affinity Diagram to develop ideas to solve problems (like barriers to on-time delivery), then you will need to reach agreement on the major barriers on the diagram and put together a team to work on those major barriers. So, how you use a completed Affinity Diagram depends on why you started it.
Summary
An Affinity Diagram is a method of quickly organizing many ideas in a complex issue. The process involves a team where members individually brainstorm ideas about the issue. The ideas are then randomly place on flip chart paper. The members silently group similar items into columns. Once complete, the headings for each column are added. This process allows you to find new ways of looking at information in a short-time frame.
You may download an Affinity Diagram template for Excel here.
would you be kind enough to give us a printer-friendly-version button?
This publication can be downloaded here. Best Regards,Bill
Dear Dr. Bill McNeese,Thanks for sending to me this type of things to develop our priduct.Need more informations fron you in future. Thanks ! BEST REGARDS !!!T.D.Siriwardhane.ExecutiveQuality Controller.
Dear Sir,Thanks for sending the article.Good knowledge to implement during Problem Solving.