March 2013
This month’s newsletter introduces kaizen and how statistical process control (SPC) can be used to support kaizen. Kaizen events focus on getting a lot done in a very short period without a lot of data collection. That seems to go against control charts since you need data. But, control charts can help provide the objectives for the event and confirm improvements as well as helping ensure that the gains are maintained. Far too often, companies go to the “visual” of kaizen and begin to compare performance to a standard – and then they lose the knowledge that comes from understanding the variation in the process. As Dr. Don Wheeler has said:
“Those who do not use control charts to analyze data will always be at a disadvantage to those who do.”
In this Issue:
- Introduction to Kaizen
- The Opportunities
- The Kaizen Process
- Maintaining the Gains
- Summary
- Quick Links
Please feel free to leave a comment at the end of the newsletter.
Introduction to Kaizen
 Kaizen is made from two words:
- “Kai” which means to take apart and make new
- “Zen” which mean to think about so as to help others
So, kaizen equals continuous improvement. It means taking something apart, thinking about it, and making it anew by putting it back together again in a different way.
For example, you might have a process where a part is made in a four-step process. The four steps are done individually by machines in different parts of the plant. The layout is shown below.
Plant Layout Pre-Kaizen
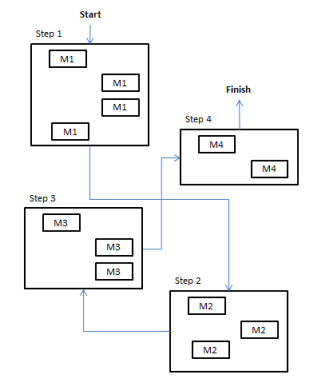
An order comes in for 500 parts. You take the raw material to the area of the plant where step 1 is done using four machines. The 500 parts go through that step. Then the material is moved to the area of the plant where step 2 is done and waits to be processed. This area just happens to be on the other side of the plant and has three machines. The parts are then processed there. Then steps 3 and 4 are performed.
There is a lot of waiting time for the parts in process – sitting in front of a manufacturing step waiting to be worked on. Plus, if you have problem in step 4, the entire 500 parts could be scrapped if it was due to something that happened back in step 1. Definitely an inefficient way to operate a process. Think of the work-in-process and all the time the product sits with no work being done on it. This type of process is perfect for a kaizen event.
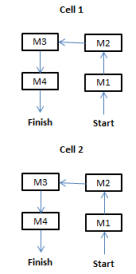
In the kaizen event, you would take this process apart, move equipment around, and create a new process that involves single-flow in a manufacturing cell. In other words, the parts are made in one area using flow – eliminating movement and waiting time. A machine from each area is put into a cell and material flows through each machine one part at a time. This is the “making new.” There is hardly any work in process and, if a problem is found, very few parts have been produced – thus scrap is reduced. Note that the flow in the cell is from right to left.
Plant Layout – Post Kaizen
A kaizen event is usually a week-long event and focuses on two major areas: solving manufacturing (or office) problems and eliminating process waste. Kaizen events are problem solving events. A team is formed to run the event. But the entire plant supports the team. This means that anything the team needs, they get as soon as possible. For example, if a team wants a machine moved from point A to point B, maintenance gets it done immediately. The team has priority during the kaizen event.
A kaizen event involves finding the problems in the process, determining what causes the problems, agreeing on potential solutions and then implementing those solutions. It is basic problem solving – however, it is really turbo problem solving because the cycle is repeated each day – maybe multiple times.
The following is true of kaizen events:
- A team approach is used
- There is a lot of activity in a short time frame
- All support groups (maintenance, engineering, lab, etc.) are available to help at a moment’ notice
- The emphasis is on action – not in-depth analysis
- The progress of the team is reviewed daily
- The goal is to achieve flow in a process
The Opportunities
Before a kaizen event, you must determine the opportunity for improvement. Opportunities usually exist because of a gap between what a customer (including leadership) wants and what the current process generates. Opportunities usually fall into four broad measurement dimensions: quality, quantity, cost, and time. Examples of opportunities for improvement include:
- Long setup or changeover times
- Long lead times
- Scrap and rework levels
- Large inventories
- Excessive downtime
- Poor on-time delivery performance
- Excessive overtime
- Excessive movement of material
- Equipment bottlenecks
- Excessive accidents
- Excessive paperwork
Prior to the event, multiple goals based on past data collection are set. This is one area where SPC can help. For example, suppose the issue is excessive set-up time on a major piece of equipment. Data must be collected on how long the set-up time takes. Many would say that limited data are sufficient for a kaizen event. However, if the set-up time is that important, you will need to be measuring before, during and after the kaizen event. So, why not use control charts? Repeating what Dr. Don Wheeler has said: “Those who do not use control charts to analyze data will always be at a disadvantage to those who do.”
The table below shows the setup times for a machine before a kaizen event started. The last ten setups are included.
Machine Setup Times
|
Setup No. |
Time (Minutes) |
|
1 |
54 |
|
2 |
47 |
|
3 |
63 |
|
4 |
71 |
|
5 |
54 |
|
6 |
57 |
|
7 |
68 |
|
8 |
54 |
|
9 |
62 |
|
10 |
49 |
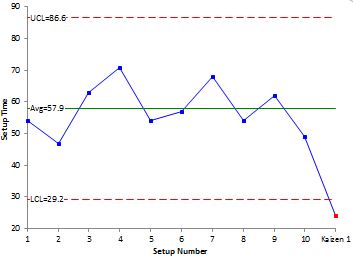
The figure below shows the X (individuals) chart for these data. The moving range is not shown.
X Chart for Baseline Machine Data
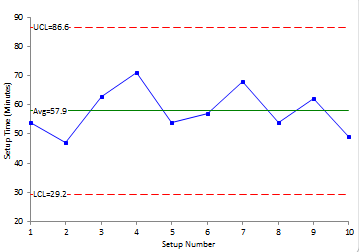
The average setup time is about 58 minutes, with an UCL of 87 and LCL of 30. These control limits will be used to judge improvements during the event.
Goals need to be set for the kaizen event. How much improvement do you want? Major improvements are sought. These are “big, hairy, audacious” goal of kaizen:
- 90% reduction in set-up time
- 50% reduction in space required
- 90% reduction in operator walking distances
- 90% reduction in work in progress
- 50% increase in productivity
The Kaizen Process
The basic kaizen process that a team follows is shown in the figure below. This pattern is repeated at least daily for each day of the kaizen event.
The Kaizen Process
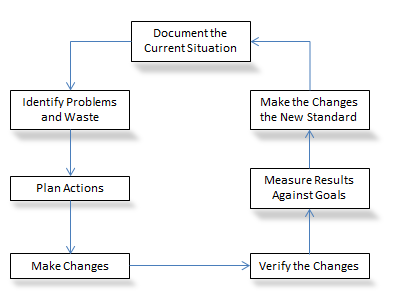
The team documents the current situation using various kaizen tools. The team then identifies problems and waste in the process and plans actions to solve the problems and remove the waste. The changes are made as soon as possible. The goal is to have the changes made within the day. The changes are then verified by observing and documenting the process. The results are measured against the goals. The improvements become the new standard. The process is repeated until the event ends. The objective is a 50% improvement in each cycle.
Documenting the Current Situation
This step helps us understand how the process is performing today. The team goes out into the plant and observes the process. The kaizen tools to help do this includes:
- Time Observation Form – used to record the time for each step in a process
- Standard Work Layout Form (Spaghetti Diagram) – used to monitor where an operator walks
- Standard Work Combination Form –used to show the combination of manual work time, walk time, and machine processing time for each operation in a production sequence
Identify Problems and Waste
The team focuses on identifying problems and waste that need to be removed from the process. For example, you have used your time observation form to monitor the steps in the time to perform the machine setup. A Pareto diagram can be used to show the steps that take the most time. The step with the most time probably can be reduced significantly. A cause and effect diagram can be used to determine how to reduce the setup time. The team does not focus on capital investment – it focuses on what can be done now!
Plan Actions
The team then develops plans to remove problems and waste. Remember the emphasis is on action, not planning and analysis.
Make Changes
The theme here is “get it done.” The team reaches consensus on how to quickly make the changes identified. Progress meetings are held at the end of the day.
Verify Changes
The process is documented again. Were the desired results achieved? If not, the team goes back and makes additional changes. Then, the team re-verifies with additional observations. The team takes the action that is needed to reach the goal within the event time frame.
Measure Results
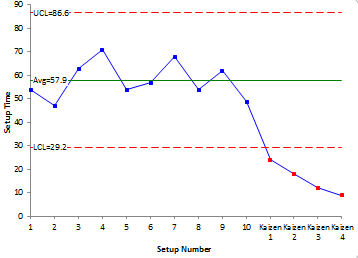
The results are measured against the goals for the kaizen event. This is another area where SPC can be used. You can show the results on the control chart. For example, if the goal is to reduce setup time on the machine, the control chart can show if the result was indeed an improvement. Back to the example above: suppose after the first day, the new setup time is 24 minutes. A huge improvement from the 58 minute average for the last ten setups. It meets the 50% improvement objective for the day. The figure below shows the control chart with the new point added (Kaizen 1). The new point is out of control signaling a significant improvement in setup time. Each time a new result is obtained, it can be plotted on the control chart.
Machine Setup Time with First Kaizen Result
Make the Changes the New Standard
The procedures are changed to include the improvements found during the event. This includes training everyone in the new process.
Maintaining the Gains
This represents another area where SPC can be used. The kaizen event has ended. The figure below is the control chart showing the four kaizen results for setup times.
Kaizen Results for Setup Time
Now the process is run at the new conditions. The new process is monitored by continuing to measure the setup times, and once there are sufficient points, new control limits are calculated. This is shown in the figure below.
New Control Limits for Improved Setup Time
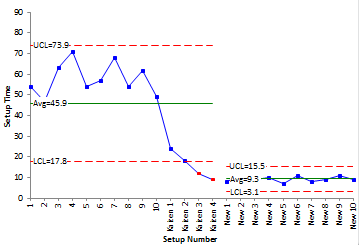
The new average is 9.3 with an UCL of 15.5 and LCL of 3.1. The improved process is very clear in the control chart. In fact, measuring the setup times to the nearest minute probably needs to be changed. Do you know why?
Summary
This newsletter has introduced kaizen events and has demonstrated where control charts can be used to support kaizen events. Far too often, companies go to “visual” as comparing performance to a single standard – not looking at how the data evolves over time. And again, from Dr. Don Wheeler,
“Those who do not use control charts have no advantage over those who can’t.”