In this issue:
Do you regularly struggle with improving processes? It is hard to get employees focused on continual improvement as they struggle with the day- to-day problems that always seem to occur in the workplace. However, we need to improve to stay competitive. And the key to improving the products and services we provide to our customers is our ability to focus on and improve the processes that generate those products and services. A great way to do this is to hold regular natural team meetings. A natural team consists of people who work on the same process. It can also be defined as a supervisor and his/her direct reports. Part of the natural team meeting should be spent on process management and improvement. This e-zine introduces a model that natural teams can use to continuously manage and improve the processes in their work areas.
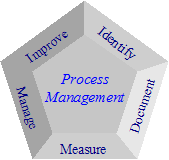
Process Management Model

The first step is to identify the purpose of the process – why it exists. This is the process mission and it must support the vision and mission of the company. This step also involves identifying the customers and suppliers of the process and their needs and expectations. The second step of the method is to document the processes. This means developing a process flow diagram as well as standard operating procedures and job work instructions if required. At this point, if there are obvious changes that can be made to improve the process, the changes are implemented.
The third step is to measure the process. Measurements should be taken over time so improvements can be seen. Manage is the fourth step. This involves setting standards for the process, bringing the process into control, determining the process capability and using problem- solving techniques to improve the process if it is not capable of meeting the standard.
The last step is to improve the process. The objective of this step is define what world-class is for the process and take steps to move towards the world-class process and perfection.
Each step is described in detail below. You can visit our website to download a pdf file that contains process flow diagrams for each of the steps.
 Identify
Step 1 is to identify the purpose of the process. These steps are given below. Remember, you can download a pdf file with process flow diagrams for each step from our website.
Step 1A: Review or Develop the Mission of the Process.
The first step is to define the mission of the process. If this mission already exists, it should be reviewed for completeness. A mission represents the purpose of the process — what the process should accomplish on a day-to-day basis.
One method of developing a mission statement is to use the following steps:
1. Brainstorm to develop a list of all the results from the process.
2. Select the major results.
3. Write a one or two sentence statement that describes these major results.
End Product = A written mission statement for the process.
Step 1B: Define How the Mission Statement is Linked to the Company’s Vision and Mission Statements.
To align the organization, it is important that all mission statements be linked to the company’s vision and mission statements. Be sure that keywords in the process’s mission statement support some of the key phrases in the vision and mission statements of the company. You should be able to verbally explain how the mission of the process supports the company’s statements.
End Product = The team understands and can explain how the process’s mission supports the company’s vision and mission.
Step 1C: Identify Customers and Suppliers for the Process.
As with any process improvement effort, one of the first steps is determining who the customers and suppliers are. The team should brainstorm a list of the customers and suppliers of the process, being sure to include internal as well as external customers and suppliers, if applicable.
End Product = A list of internal and external customers and suppliers for the process.
Step 1D: Identify Customer and Supplier Needs and Expectations.
Next, the team should identify the needs and expectations of the customers and suppliers of the process. For external customers and suppliers, this information can be gathered by formal surveys, informal interviews or by asking other associates in the company what needs and expectations customers or suppliers have expressed to them. For internal customers and suppliers, this information can be gathered using informal methods.
The team could also brainstorm what they think customers and suppliers need and expect. Team members could then ask the customers and suppliers what they need and expect. This would give the team an indication of how well they know the customers and suppliers. If the customers and suppliers list the same items the team did, then the team is staying in touch with the customers and suppliers. If not, the team should address why they did not know what their customers and suppliers needed.
About 98% of the time, you will know your customer and supplier needs and expectations. However, you may discover that there are some customer or supplier needs that are not being met. If this is the case, the team should begin to address these needs – – either within the team or through another team.
End Product = A list of needs and expectations of customers and suppliers of the process.
Document

Step 2A: Develop the process flow diagram.
All processes in which failure of the process will hurt the quality of the service or product delivered to the internal or external customer should have process flow diagrams. A process flow diagram represents the logical flow of activities from the start to the end of the process. A key point in developing the process flow diagram is setting these starting and ending points. This sets the boundaries for the process. If any obvious changes are needed once the process flow diagram is complete, these changes should be implemented immediately and the process flow diagram updated.
End Product = A completed process flow diagram.
Step 2B: Determine if SOPs/JWIs are required and develop, if required
At times, a process flow diagram will not be sufficient for documenting the process. This could be the case for complicated processes. It could be a requirement in your ISO 9000 system. If the process flow diagram is not sufficient, standard operating procedures and job work instructions should be written for the process.
End Product = Written SOPs/JWIs completed if necessary.
Measure

Step 3A: Review the Current Process Flow Diagram.
The team should review the current process flow diagram for the process. If any revisions are required, the team should update the process flow diagram.
End Product = The process diagram has been reviewed or updated.
Step 3B: Determine the Measurement Points in the Process.
Determine where the process should be measured. Note that each step in the process flow diagram is a potential step where a measurement could be made. Diamonds (the yes/no boxes) are often very good steps to measure. These decision boxes often represent rework in the process. The team should consider measuring the process in four dimensions: quality, quantity, timeliness, and cost.
The team should also try to move measurement as far upstream in the process as possible. Measurements taken only at the end of the process will help detect problems once they have occurred, but they will not help prevent the problems from occurring.
End Product = A list of measurement points for a process.
Step 3C: Define How the Measurement Will Be Done.
Starting a new measurement is not always easy. There are many items that must be completed to ensure that the measurement is successful.
Determine who is responsible for taking the measurement. This depends on what the measurement is. The person who most directly controls the measurement should be responsible for it. For example, a picker in the warehouse should be responsible for his picking accuracy measurement. The picking supervisor should be responsible for the picking accuracy measurement for all pickers.
Determine how often the measurement should be taken. In general, the more frequent the measurement, the better. This allows an associate to take action if a problem does occur. Daily measurements are best. Weekly measurements are also valuable, particularly if there is a lot of variation in the daily measurement (such as sales). Monthly measurements are adequate for some things (such as financial results). Measurements beyond monthly are usually useless for process improvement.
Determine how the measurement will be taken. How will the associate get the data (e.g., manually, from the system, etc.)? If the data must be taken manually (and some will be), develop checklist or data collection sheets that will be needed.
Make sure your operational definitions are in place. Determine how and where the measurement will be displayed. It is best to look at the measurement over time. Use a time series chart to display the results whenever possible. This includes run and control charts. Often a Pareto diagram will be needed to show the reasons for defects or defective items. The charts should be displayed in the associate’s work area.
Determine how the associate should respond to out-of-control points on a control chart or other problems. Once the measurement is in place, we expect the associate to respond to problems that are indicated by the measurement. Each measurement should have a control strategy in place that tells the associate what to do if the process is out of control or if there is a problem.
End Product = A detailed plan for implementing the measurement.
Step 3D: Implement the Measurement
At this point, the measurement is implemented. Taking data represents a change to the process and to the behavior we want from the associate. Routine follow-up will be required until the measurement is being taken regularly.
End Product = The measurement has been implemented.
Manage

Step 4A: Define Process Standards
Each process has a mission statement –a reason it was designed and put into place. In addition, each process has measurements that reflect whether or not the mission is being accomplished. For example, if the process is picking in a warehouse, one measurement might be picking accuracy.
Most measurements should have a “standard.” A standard represents where the process should be operating. For example, the process standard for picking might be 99.8% accuracy. This is the standard — where we want the process to operate. In manufacturing, the standards are usually specifications from the customer. In service areas, the standards can be specifications from the customers or standards set internally by management. The standards should be possible to achieve. For example, it is not possible in most organizations to achieve 100% on-time delivery. Realistic standards should be set. However, there should be continual improvement in the standards over time.
End Product = Process standards have been set for each process measurement in place, if applicable.
Step 4B: Monitor Process Results Using a Control Chart.
Measurements for the process should have been put in place in step 3. These measurements are monitored over time, in most cases, by plotting the results on a control chart and interpreting the chart.
End Product = Control chart on measurements in place and routinely updated.
Step 4C: Is the Process in Control?
In this step the control chart is interpreted to determine if the process is in control. If the process is in control, proceed to step 4D. If the process is out of control, proceed to step 4G. Control charts are how we communicate with the process. A special cause of variation exists if there are points beyond either control limit, if there are seven points in a row above the average, or seven points in a row trending up or trending down.
End Product = Decision on whether or not the process is in statistical control.
Step 4D: Reinforce and Recognize Associates.
This step is followed if it is determined that the process is in control. When a process is in control, variation is stable and the process is doing the best that it currently can. Any improvement in the process must come from fundamentally changing the design of the process. Associates should be recognized for keeping the process in control.
End Product = Associates recognized for keeping the process in control.
Step 4E: Is the Process Capable of Meeting the Process Standards?
The process standards were set in Step 4A. The actual performance of the process should be compared to these standards. If the standards are not being met, proceed to step 4F. If the standards are being met, continue to monitor the process (Step 4B).
To determine if the process standard is being met, you can use a process capability analysis or a histogram with the standard added.
End Product = Determination made of whether the current process meets the process standards.
Step 4F: Improve the Process.
This step is followed if it is determined that the process is not meeting the process standard. At this point the team determines what steps can be taken to improve the process. The team can follow the problem-solving model (see our May 2004 e-zine). Help could be requested from another team or person.
End Product = Steps taken to improve the process.
Step 4G: Find the Special Cause.
In this step, the special cause of variation is found. Typically, a special cause of variation can be traced to one event, something that changed in the process.
End Product = The special cause of variation has been identified.
Step 4H: Is Special Cause Training-Related?
In this step any special cause variation is analyzed to determine if it is due to associates not knowing how to operate the process. Often special causes result when a new associate is hired or when someone is out for a while. If the special cause of variation is training-related, proceed to step 4I. If it is not training-related, proceed to step 4J.
End Product = Determination made as to whether the special cause of variation was training related.
Step 4I: Do Corrective Coaching.
This step is followed if it is determined that the special cause of variation is training-related. In this step the associate who is closest to the special cause of variation receives corrective coaching or specialized training for the procedure involved. The appropriate part of the SOPs and JWIs should be reviewed with the associate to communicate what is needed to operate the process properly and why it is needed. Once corrective action is taken, return to step 4B (monitoring the process).
End Product = Corrective coaching done with associate in the event of a training-related special cause of variation.
Step 4J: Remove Special Cause.
This step is followed if it is determined that there is a special cause of variation present that is not training-related. Steps must be taken to identify the root cause of the special cause and to permanently remove the special cause of variation from the process (or to include the special cause if it is “good”). This step may entail empowering a team to work on the problem. Once the special cause of variation is removed, return to step 4B (monitoring the process).
End Product = Special cause of variation permanently removed from the process.
Improve

Step 5A. Benchmark Similar Processes.
Benchmarking can be used to find out how similar processes operate. The objective here is to not reinvent the wheel. If someone else is doing something better, the team should find out how it is being done and implement the changes. Sources for benchmarking include customers, suppliers, competitors, companies in other markets and the Internet.
End Product = A summary of what was found out from benchmarking efforts.
Step 5B. Implement Improvements Found From Benchmarking.
The team develops the implementation plan for the improvements found from benchmarking and follows the implementation plan.
End Product = Improvements found from benchmarking implemented.
Step 5C: Develop a Vision of What the Process Could Be.
There are several ways the team could do this. A good way for the team to get started is to pose Joel Barker’s “Impossibility Question” – “What is impossible to do today in this process, but if we could do it would radically transform the way we do business?” Another way is for the team to review information on creativity and use some of the proven techniques for enhancing creativity. Any new strategies that are developed should be implemented.
End Product = A vision of what the process could be in the future.
Step 5D: Move Towards Perfection
The team continually seeks to reduce the number of defects in the process. The team may need outside assistance to move in this direction. Techniques to apply include kaizen, mistake proofing, and the six- sigma methodology.
End Product = A commitment to continually strive for perfection.
Summary
This newsletter introduced a five-step model for managing a process. It ends with improving the process. But you can’t improve a process until you can manage it. You can’t manage it until you can measure it. You can’t measure it until you can document. And you can’t document it until you can define it!
 Identify