May 2005
This month is the third in a multi-part publication on X-R charts. In the first part, we introduced the X-R chart and provided the steps in constructing an X-R chart. Last month, we looked at a detailed example of an X-R chart. This month we will look at rational subgrouping and how it applies to X-R charts.
The X-R chart is a type of control chart that can be used with variables data. Like most other variables control charts, it is actually two charts. One chart is for subgroup averages ( X). The other chart is for subgroup ranges (R). These charts are a very powerful tool for monitoring variation in a process and detecting changes in either the average or the amount of variation in the process.
In this issue:
Rational Subgrouping Overview
Rational subgrouping is a primary topic in the study of sampling procedures. You want to take data to get the most information possible. A major objective of sampling is to estimate population parameters (the average, standard deviation, and shape of the distribution). The population you are studying is the one represented by your sample. It is possible that this population is not necessarily the one you had in mind.
Samples should be selected in a way that explores the variation of interest to you. The variation of interest might be shift-to-shift, day-to-day, hour-to-hour, batch-to-batch, etc. One possible way of looking at control charts is that they are a statistical test to determine if the variation from subgroup to subgroup is consistent with the average variation within the subgroups. A basic principle is to choose the subgroups in a way that will give the maximum chance for the measurements in each subgroup to be alike and the maximum chance for the subgroups to be different.
The most obvious rational subgrouping basis is the order of production. Even then, you have a choice on how to take samples. For example, you could take a group of five items, wait a while, then take five more, etc. Or you could take every third item until you had five, wait a while, then continue taking every third until you had five, wait a while, etc. The first might be more likely to miss a process change that occurred and got corrected; the second might miss small process cycles.
Subgrouping is important. For example, suppose that you are making a chemical product in a batch reactor. There is always variation from batch to batch. If the product is well mixed in the reactor, the within-batch variation may be small. If subgroups were set up using four samples from one batch, the X chart will probably be out of control. In this instance, it is not reasonable to expect the batch-to-batch variability to be consistent or the same as the within-batch variability. It would make more sense in this case to use an individuals chart. The batch averages would be plotted on the X (individuals) chart and the moving range between successive batch averages would be plotted on the range chart.
The basic idea behind rational subgrouping is to let the X chart do the work. This will occur as long as the subgroups are chosen in such a way that there is minimum chance for change to occur within a subgroup and maximum chance for a change to occur between subgroups. All sources of variation contributing to the range chart should also be sources of variation in the X chart. This will be true as long as production run order is maintained.
It is not necessary to always have the subgroups in production run order. For example, an X-s chart could be used to compare different suppliers with a subgroup being material sent by one supplier. If production run order is not maintained, the only test for stability that applies is points beyond the control limits.
Rational Subgrouping Example
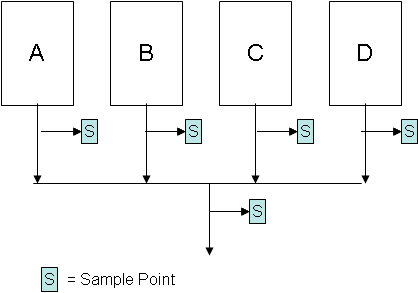 There are four machines that make the same product. A certain quality characteristic, X, is of interest to a customer. There are several potential methods of subgrouping the data to be used in control charts. The possible sampling points are given in the figure. Three different subgrouping plans are presented below. Which one do you think is best?
Plan A
Select the first subgroup to consist of four samples from machine A, the second subgroup to consist of four samples from machine B, the third subgroup to consist of four samples from machine C and the fourth subgroup to consist of four samples from machine D. Repeat this sequence over time.
Plan B
Select one sample from each machine to form the subgroup of four each time.
Plan C
Select each subgroup to consist of four samples from the blended stream.
To determine which plan is best, you need to look at the control charts generated from each subgrouping plan. The data are given below for the three plans. Use these data to construct the control charts and answer the questions given below for each plan. Next month, we will look at the control charts, the answers to the questions, and see if you picked the right subgrouping plan. The data in an Excel workbook can be obtained by going to our website at the link below, plus you can see the previous e-zines on X-R charts.
This example is from the University of Tennessee SPC course in 1986.
Download the data for the different plans by clicking here.
Plan A
| Subgroup | Machine | 1 | 2 | 3 | 4 | Xbar | Range |
|---|---|---|---|---|---|---|---|
| 1 | A | 17 | 18 | 19 | 20 | 18.5 | 3 |
| 2 | B | 24 | 20 | 19 | 20 | 20.8 | 5 |
| 3 | C | 25 | 27 | 27 | 22 | 25.3 | 5 |
| 4 | D | 26 | 23 | 24 | 23 | 24 | 3 |
| 5 | A | 21 | 19 | 20 | 20 | 20 | 2 |
| 6 | B | 19 | 18 | 24 | 22 | 20.8 | 6 |
| 7 | C | 25 | 25 | 26 | 23 | 24.8 | 3 |
| 8 | D | 23 | 26 | 27 | 24 | 25 | 4 |
| 9 | A | 20 | 21 | 15 | 17 | 18.3 | 6 |
| 10 | B | 20 | 19 | 21 | 20 | 20 | 2 |
| 11 | C | 23 | 20 | 25 | 19 | 21.8 | 6 |
| 12 | D | 26 | 23 | 29 | 23 | 25.3 | 6 |
| 13 | A | 19 | 19 | 19 | 21 | 19.5 | 2 |
| 14 | B | 16 | 19 | 18 | 22 | 18.8 | 6 |
| 15 | C | 26 | 27 | 24 | 21 | 24.5 | 6 |
| 16 | D | 24 | 27 | 25 | 27 | 25.8 | 3 |
| 17 | A | 18 | 18 | 23 | 19 | 19.5 | 5 |
| 18 | B | 17 | 20 | 19 | 15 | 17.8 | 5 |
| 19 | C | 24 | 26 | 28 | 26 | 26 | 4 |
| 20 | D | 24 | 24 | 22 | 25 | 23.8 | 3 |
| 21 | A | 23 | 19 | 21 | 19 | 20.5 | 4 |
| 22 | B | 22 | 20 | 19 | 22 | 20.8 | 3 |
| 23 | C | 25 | 25 | 23 | 26 | 24.8 | 3 |
| 24 | D | 24 | 25 | 28 | 26 | 25.8 | 4 |
| 25 | A | 17 | 22 | 21 | 18 | 19.5 | 5 |
| 26 | B | 19 | 21 | 20 | 24 | 21 | 5 |
| 27 | C | 22 | 24 | 27 | 26 | 24.8 | 5 |
| 28 | D | 25 | 24 | 23 | 27 | 24.8 | 4 |
| 29 | A | 23 | 18 | 18 | 20 | 19.8 | 5 |
| 30 | B | 19 | 19 | 19 | 18 | 18.8 | 1 |
| 31 | C | 22 | 27 | 27 | 25 | 25.3 | 5 |
| 32 | D | 25 | 27 | 23 | 25 | 25 | 4 |
Use the data for plan A to construct an X-R chart. Answer the questions below.
1. Is the range chart in statistical control? What does this mean?
2. If the range chart is in statistical control, what is the estimate of the standard deviation? What is the standard deviation measuring?
3. Is the X chart in statistical control? What does this mean?
4. What explanations do you have for the way the X chart looks?
Plan B
| Subgroup | A | B | C | D | Xbar | R |
| 1 | 19 | 19 | 25 | 27 | 22.5 | 8 |
| 2 | 22 | 22 | 20 | 25 | 22.3 | 5 |
| 3 | 18 | 19 | 26 | 26 | 22.3 | 8 |
| 4 | 16 | 18 | 25 | 27 | 21.5 | 11 |
| 5 | 21 | 18 | 25 | 23 | 21.8 | 7 |
| 6 | 20 | 21 | 24 | 24 | 22.3 | 4 |
| 7 | 22 | 20 | 26 | 24 | 23 | 6 |
| 8 | 20 | 19 | 22 | 26 | 21.8 | 7 |
| 9 | 21 | 20 | 24 | 29 | 23.5 | 9 |
| 10 | 21 | 22 | 25 | 26 | 23.5 | 5 |
| 11 | 21 | 21 | 25 | 24 | 22.8 | 4 |
| 12 | 17 | 16 | 25 | 23 | 20.3 | 9 |
| 13 | 18 | 21 | 22 | 26 | 21.8 | 8 |
| 14 | 23 | 23 | 26 | 23 | 23.8 | 3 |
| 15 | 19 | 18 | 24 | 22 | 20.8 | 6 |
| 16 | 21 | 20 | 26 | 24 | 22.8 | 6 |
| 17 | 19 | 20 | 25 | 27 | 22.8 | 8 |
| 18 | 17 | 20 | 26 | 28 | 22.8 | 11 |
| 19 | 16 | 24 | 23 | 27 | 22.5 | 11 |
| 20 | 20 | 19 | 26 | 26 | 22.8 | 7 |
Use the data for plan B to construct an X-R chart. Answer the questions below.
1. Is the range chart in statistical control? What does this mean?
2. If the range chart is in statistical control, what is the estimate of the standard deviation? What is the standard deviation measuring?
3. Is the X chart in statistical control? What does this mean?
4. What explanations do you have for the way the X chart looks?
5. How can you explain the difference in R for subgrouping plan A and subgrouping plan B?
Plan C
| Subgroup | A | B | C | D | Xbar | R |
| 1 | 19 | 19 | 25 | 27 | 22.5 | 8 |
| 2 | 22 | 22 | 20 | 25 | 22.3 | 5 |
| 3 | 18 | 19 | 26 | 26 | 22.3 | 8 |
| 4 | 16 | 18 | 25 | 27 | 21.5 | 11 |
| 5 | 21 | 18 | 25 | 23 | 21.8 | 7 |
| 6 | 20 | 21 | 24 | 24 | 22.3 | 4 |
| 7 | 22 | 20 | 26 | 24 | 23 | 6 |
| 8 | 20 | 19 | 22 | 26 | 21.8 | 7 |
| 9 | 21 | 20 | 24 | 29 | 23.5 | 9 |
| 10 | 21 | 22 | 25 | 26 | 23.5 | 5 |
| 11 | 21 | 21 | 25 | 24 | 22.8 | 4 |
| 12 | 17 | 16 | 25 | 23 | 20.3 | 9 |
| 13 | 18 | 21 | 22 | 26 | 21.8 | 8 |
| 14 | 23 | 23 | 26 | 23 | 23.8 | 3 |
| 15 | 19 | 18 | 24 | 22 | 20.8 | 6 |
| 16 | 21 | 20 | 26 | 24 | 22.8 | 6 |
| 17 | 19 | 20 | 25 | 27 | 22.8 | 8 |
| 18 | 17 | 20 | 26 | 28 | 22.8 | 11 |
| 19 | 16 | 24 | 23 | 27 | 22.5 | 11 |
| 20 | 20 | 19 | 26 | 26 | 22.8 | 7 |
Use the data for plan C to construct an X-R chart. Answer the questions below.
1. Is the range chart in statistical control? What does this mean?
2. If the range chart is in statistical control, what is the estimate of the standard deviation? What is the standard deviation measuring?
3. Is the X chart in statistical control? What does this mean?
4. What explanations do you have for the way the X chart looks?
5. How can you explain the differences in R for subgrouping plan A, subgrouping plan B, and subgrouping plan C?
6. Which subgrouping plan is best?
ANSWERS NEXT MONTH!