Our last blog, The Red Bead Experiment, described a simple process to teach variation to everyone. This blog describes another simple experiment that shows the danger of not using the knowledge of variation you learned from the red beads.
Dr. Deming said, “If anyone adjusts a stable process for a result that is undesirable, or for a result that is extra good, the output that follows will be worse than if he had left the process alone.” This is often called tampering with or over-controlling the process.
For example, a manufacturing facility dried resin in a dryer. The ideal water content of the resin was 0.10%. It was measured hourly. It was common practice to increase the dryer temperature if the resin was too moist (above 0.10%) or to decrease the dryer temperature if the resin was too dry (lower than 0.10%). The operators were just trying to do their best. Unfortunately, their tampering with the process in this manner was actually increasing the variation in the results. They were over-controlling the process.
An excellent example of over-controlling is the funnel experiment described by Dr. Deming. The objective of the funnel experiment is to drop a marble through a funnel and hit a target. A point on a level surface is designated as the target. A funnel is held a certain distance above the surface. A marble is dropped through the funnel. The spot the marble comes to rest on the surface is marked. This is repeated for at least 50 drops for each of four different rules, but we will only cover the two rules that govern the overcontrolling example above.
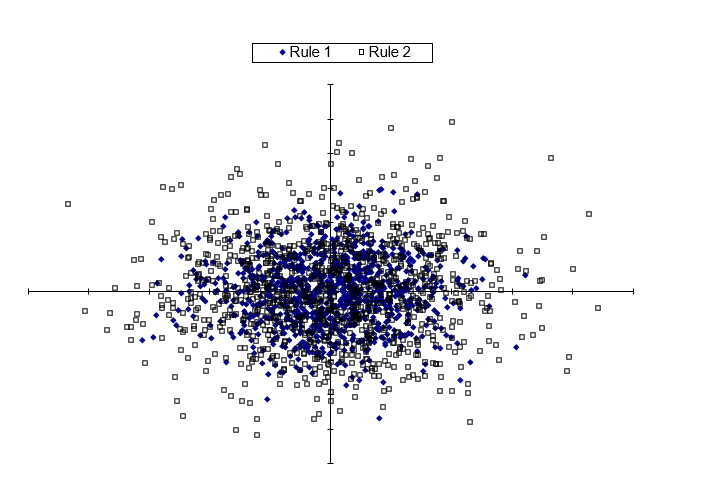
- Rule 1: Leave the funnel fixed over the target (no tampering).
- Rule 2: For every drop, the marble will come to rest a distance “z” from the target. Rule 2 is to move the funnel a distance -z from its last position (overcontrolling like the example above).
Both these rules lead to processes that are in statistical control. A computer simulation of these two rules is shown below.
Both generate circles. However, as you can see in the figure above, Rule 2 has a much wider variation – in fact 40% more variation than Rule 1. So, attempting to adjust a process that is in statistical control will create more variation in the process.
For a complete description of the funnel experiment including all four rules, please see our SPC Knowledge Base article, Over-controlling a Process: The Funnel Experiment.
