
May 2026
 Semiconductor manufacturing is one of the most advanced and precise production processes in the world. Modern semiconductor devices are built on silicon wafers through hundreds of processing steps, where even small amounts of variation can affect product performance and yield. To maintain consistent quality, manufacturers routinely monitor critical characteristics such as wafer thickness and thickness uniformity.
In this publication, we examine how statistical process control (SPC) can be used to monitor the production of semiconductors. We will look at two options: one for X-R control charts and one for individuals (X-mR) charts. In this issue:
Please feel free to leave a comment at the end of this publication. You can download a pdf version at this link.
See what your data looks like in SPC for Excel! Try the free 30-day demo now!
Introduction
Semiconductors have the ability to partially conduct electricity, hence the name “semi.” The ability to partially conduct electricity lies between a conductor (such as copper) and an insulator (such as glass). Silicon is a common semiconductor material. Semiconductors are found in integrated circuits, memory chips, sensors, etc. They are found in products such as televisions, smartphones, medical devices, etc. Engineers can control the electric properties of semiconductors. This allows the engineers to create tiny electronic circuits that can do many things – such as performing complex calculations or controlling a product.
Semiconductor manufacturing steps include deposition, photolithography, etching, ion implantation, polishing, and testing performed on thin silicon wafers. Because modern semiconductor features are measured in nanometers, even extremely small amounts of process variation can impact product performance, reliability, and yield. This process variation can be monitored using SPC.
X-R Control Chart Example
You are an engineer overseeing semiconductor manufacturing. You want to monitor the production process to ensure that the silicon wafers have the “same” width. For you, this means that the process is in statistical control and is meeting specifications.
The first step in using an X-R control chart with semiconductor manufacturing is to decide on rational subgrouping. How do you want to subgroup the data to explore the variation you are interested in?
You decide that you want to monitor the process performance hourly. Note that there are many subgrouping schemes based on time you can use. We will use the hour approach for this example.
Five wafers were sampled each hour. Each wafer thickness value shown below in Table 1 is the average of five measurement locations across that wafer surface. Thus, each subgroup contains five wafer-average thickness values. The thickness values are given in microns.
Table 1: Five Wafer Average Thickness Data
| Hour | Wafer 1 | Wafer 2 | Wafer 3 | Wafer 4 | Wafer 5 |
| 1 | 773.2 | 775.1 | 776.1 | 774.4 | 774.1 |
| 2 | 774.3 | 775.5 | 776.7 | 774.5 | 775.1 |
| 3 | 774.5 | 774.9 | 774.2 | 775.3 | 774.5 |
| 4 | 774.8 | 776.8 | 774.4 | 775.4 | 772.7 |
| 5 | 777.0 | 775.3 | 774.5 | 774.7 | 775.0 |
| 6 | 775.5 | 773.5 | 774.7 | 775.5 | 773.2 |
| 7 | 774.7 | 775.6 | 776.7 | 775.3 | 775.2 |
| 8 | 774.3 | 774.1 | 774.6 | 775.3 | 773.3 |
| 9 | 775.4 | 774.1 | 774.9 | 777.1 | 773.8 |
| 10 | 774.6 | 776.8 | 774.3 | 775.6 | 774.8 |
| 11 | 775.1 | 774.8 | 775.2 | 774.4 | 774.1 |
| 12 | 775.8 | 773.8 | 776.0 | 775.6 | 774.5 |
| 13 | 774.5 | 775.0 | 776.4 | 775.5 | 774.7 |
| 14 | 776.7 | 776.8 | 773.1 | 776.3 | 775.8 |
| 15 | 775.1 | 776.1 | 776.2 | 773.7 | 775.7 |
| 16 | 775.2 | 775.5 | 774.4 | 774.6 | 775.5 |
| 17 | 776.0 | 774.6 | 776.6 | 776.3 | 773.5 |
| 18 | 776.1 | 776.6 | 774.7 | 774.3 | 774.2 |
| 19 | 774.7 | 775.0 | 776.4 | 774.2 | 774.2 |
| 20 | 774.7 | 774.7 | 774.2 | 775.9 | 774.4 |
We will use these data to construct the X-R control chart. Each hour in the table above represents a subgroup. You calculate a subgroup average for each hour as well as a subgroup range for each hour. The range is the maximum result minus the minimum result for that hour.
There are two charts: the X chart where the subgroup averages are plotted and the R chart where the subgroup ranges are plotted. The overall average is plotted on the X chart while the average range is plotted on the R chart. The control limits for both charts are then calculated and added to their respective control charts. For more information on the X-R control chart calculations, please see our SPC Knowledge Base article Xbar-R Charts – Part 1.
There are two control limits for most control charts. The upper control limit (UCL) represents the largest value you would expect if you just have normal variation (common cause) present. The lower control limit (LCL) represents the smallest value you would expect if you just have normal variation present.
If all the points are between the control limits and there are no patterns present (like 8 points in a row below the average), the process is said to be in statistical control. It is consistent and predictable. You don’t know what the next point will be, but as long as the process stays the same, it will between the LCL and UCL with a long-term average given by the calculated overall average.
However, if there are points beyond the control limits or there are patterns present, the process is said to be out of control. There are special causes of variation present. You don’t know what the process will make in the future. You must find and remove the reasons for the special causes. Please see our SPC Knowledge Base for more articles on variation.
The X and R control charts are shown in Figures 1 and 2 below respectively.
Figure 1: X Control Chart for Average Wafer Thickness

Figure 2: Range Control Chart for Average Wafer Thickness
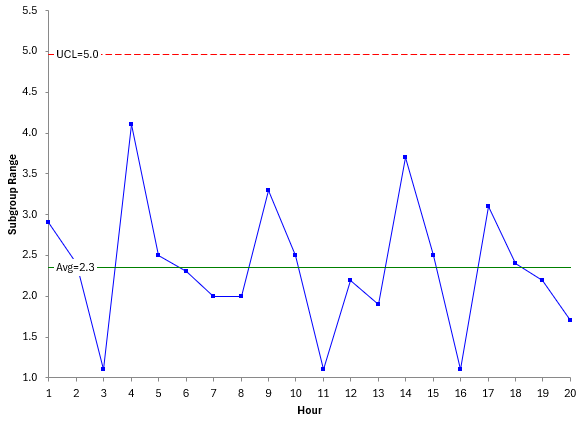
Both control charts are in statistical control. They are consistent and predictable. They will continue to produce with this range as long as the process remains the same. You can lock the control limits and judge performance versus those locked control limits in the future. For more information on when to lock and recalculate control limits, please see our SPC Knowledge Base article “When to Calculate, Lock, and Recalculate Control Limits.”
This example showed how the X-R control chart can be used to monitor wafer thickness in semiconductor manufacturing. Quite often in semiconductor manufacturing there is much more data being taken. In this case, you might be able to use the individuals (X-mR) control chart. Let’s see how that is done.
Individuals (X-mR) Control Chart Example
Suppose each wafer is measured in many more than 5 places. Suppose each wafer has 100 measurement locations. For each wafer, you would calculate:
- The average wafer thickness
- The wafer standard deviation (which measures uniformity across the wafer)
You might think that this is like the X-R chart but it is not. We are going to monitor each metric using an individuals control chart. You will have two individuals control charts – one for each metric.
So, automated metrology equipment collects 100 thickness measurements across each wafer surface. For each wafer, the average thickness and standard deviation were calculated. The average thickness and standard deviation data for 20 wafers are given in Table 2.
Table 2: Wafter Average Thickness and Standard Deviation
| Wafer | Average Thickness | Standard Deviation |
| 1 | 776.74 | 0.55 |
| 2 | 774.40 | 0.42 |
| 3 | 776.08 | 0.47 |
| 4 | 776.62 | 0.35 |
| 5 | 775.95 | 0.47 |
| 6 | 775.51 | 0.40 |
| 7 | 775.69 | 0.51 |
| 8 | 773.20 | 0.52 |
| 9 | 774.97 | 0.34 |
| 10 | 774.10 | 0.39 |
| 11 | 773.84 | 0.44 |
| 12 | 775.47 | 0.57 |
| 13 | 775.15 | 0.67 |
| 14 | 774.14 | 0.50 |
| 15 | 779.10 | 0.85 |
| 16 | 775.24 | 0.54 |
| 17 | 774.92 | 0.34 |
| 18 | 775.72 | 0.39 |
| 19 | 774.54 | 0.58 |
| 20 | 775.64 | 0.41 |
Let’s examine the thickness results first. The discussion on variation above for the X-R chart applies here; you are just dealing with individual values and not subgroups. The individual values are plotted on the X chart, while the moving range between consecutive values is plotted on the moving range chart.
The X and mR charts for thickness are shown in Figures 3 and 4 below respectively.
Figure 3: X Control Chart for Average Wafer Thickness
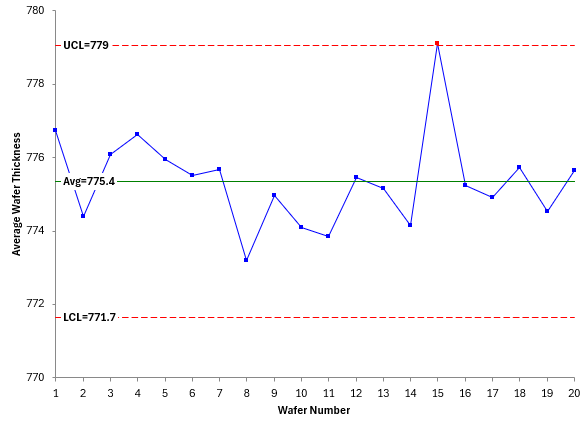
Figure 4: Moving Range Control Chart for Average Wafer Thickness
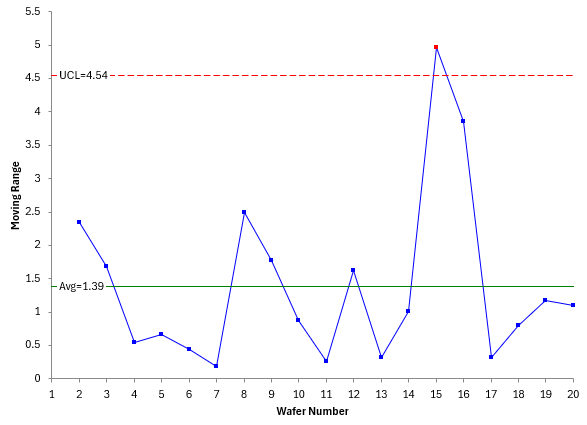
You essentially interpret the individuals control chart the same way you do for the X-R control chart. Note that the X chart and the mR chart both have a point beyond the control limits. It is for wafer 15. This wafer has a larger average thickness than the other wafers. This means that, for that point, there was special cause of variation present. The reason for it should be found and eliminated.
Figures 5 and 6 are the X chart and mR chart for the wafer standard deviation.
Figure 5: X Chart for Wafer Standard Deviation
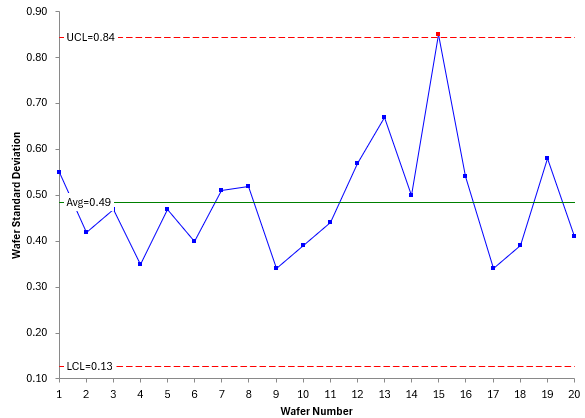
Figure 6: mR Chart for Wafer Standard Deviation

The mR chart in this example is in statistical control. There are no points beyond the control limits. However, the X chart does have one out of control point: wafer 15. This means there is significantly more variation in the 100 thickness measurements for this wafer than the other wafers.
So, wafer 15 has a higher average thickness and less uniformity (high standard deviation) than the other wafers. Again, you must find the reason for this and correct it.
Summary
This publication has examined how statistical process control (SPC) can be used to monitor semiconductor manufacturing. Two different subgrouping plans were used. One was monitoring the hourly changes to wafer thickness by taking five wafers per hour and measure the thickness of each wafer 5 times. An X-R chart was used to monitor the results.
The other plan was to use the individuals control chart to monitor the average of 100 thickness readings on the wafer and the standard deviation of those 100 measurements. The average was tracked on an individuals control chart and the standard deviation was tracked on another individuals control chart.
The SPC for Excel software handles all your control chart needs – from creating to interpreting the control charts!