October 2017
(Note: all the previous SPC Knowledge Base in the process improvement category are listed on the right-hand side. Select this link for information on the SPC for Excel software.)

Think about your processes – either at work or at home. Are your processes well-defined? Many manufacturing processes are well-defined. It is easy to follow a part through the processing steps. But what about the support processes – those like paying suppliers, receiving incoming material, or responding to a customer complaint? These processes are often not well-defined and sometimes not defined at all. Everyone does the process their own way. Talk about increasing variation in a process! And everyone thinks his/her way is the best. Ever found that someone else is doing a process more efficiently than you?
A process flow diagram provides a method of defining the steps in a process. It helps get agreement on what the process steps are. It is also easier to see where a process can be measured or improved when looking at a process flow diagram. A process flow diagram helps identify and eliminate waste.
In this issue:
- Introduction to Process Flow Diagrams
- Constructing a Process Flow Diagram
- Process Flow Diagram Examples
- Summary
- Quick Links
Please feel free to leave a comment at the end of the publication. You can download a pdf copy of this publication at this link.
Introduction to Process Flow Diagrams
A process flow diagram provides a picture of your process. It can be very detailed or more of an overview. The amount of detail in a process flow diagram depends on who the customer is for the process flow diagram. For example, you will have less detail in a process flow diagram that is describing your process to your customer than you would if you are using the process flow diagram for finding improvement areas.
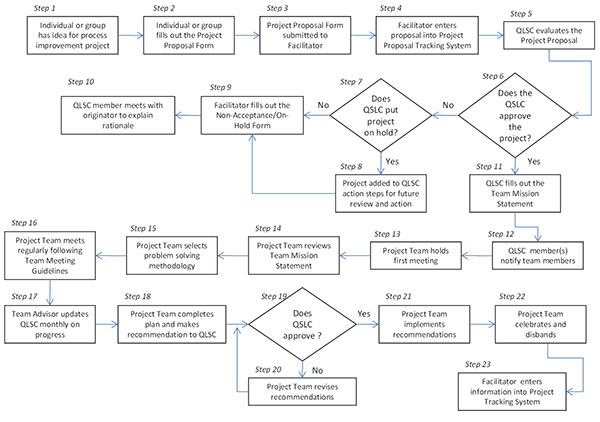
Figure 1 is a process flow diagram for empowering a project team to work on a process improvement idea. Its intended use is to explain the process to employees who may want to submit an idea for a process improvement project. So, this process flow diagram needs enough detail so an employee understands the process.
The starting point for this process is: “Individual or group has an idea for a process improvement project.” The ending point is that the facilitator enters the information into the Project Tracking System (once the project is complete). The 23 steps in this example are labeled. The steps in between the starting and ending points simply lay out the flow for empowering a project team.
Figure 1: Process Flow Diagram for Empowering a Project Team
Defining the starting and ending points for a process flow diagram is very important. This defines the “scope” of the process flow diagram. Too large a scope can lead to a huge process flow diagram.
The process flow diagram above helps an individual understand how a project team is empowered. This is why process flow diagrams are useful as training tools. A process flow diagram also helps gain consensus on what the process is, in this case, for empowering a project team.
One thing to note about the process flow diagram in Figure 1. First, only two shapes are used: a rectangle for a step in the process and a diamond for a decision point in the process. These two shapes are all you really need for a process flow diagram.
Once the process flow diagram is completed, it is easy to see where the process can be measured. This is something that is often overlooked with process flow diagrams – using them to discover where to measure a process. Ever had someone say that you can’t measure what they do? Draw a process flow diagram of his/her process, and the measurement points will be evident. Remember to think about measuring a process in four dimensions: quantity, quality, timeliness and cost.
Anytime there is a diamond on a process flow diagram, it represents a potential measurement point. For example, there are three diamonds on this process flow diagram. Each involves the QLSC, the Quality Leadership Steering Committee, which oversees this process. Potential measurements at those three points are:
- % of projects put on hold by the QLSC
- % of projects approved by the QLSC
- % of recommendations approved by the QLSC
Other potential measurements include the number of project proposals turned in per month, the time it takes to complete a project, and the dollar value of process improvements from the project teams. Again, though not normally tied together, process flow diagrams and identifying potential measurements are closely related. Every step could potentially have a measurement (not that you would want to do that).
Sometimes when you make a process flow diagram, there will be an obvious change that needs to be made. If so, make that change immediately. There is no need to wait for further analysis. For example, you may have had an issue in a process a long time, so you added some extra steps to “catch” the issue. The issue has gone away but you are still doing those extra steps!
The process flow diagram should reflect the current process, not the “intended” or “ideal” process. It should contain all the decisions in the process. If a process flow diagram does not have a single decision point (a diamond), then it is probably not a true process flow diagram. All detailed process flow diagrams have decision points.
Creating a process flow diagram has many additional benefits. For example:
- It can be a tool to improve communications between two departments (or between you and your customer) by helping each understand the other’s problems and needs.
- It can reduce variation in a process by bringing to light the steps in the process that are being done differently by different individuals.
- It can pinpoint the problem areas in a process.
- It can help teach the steps of a new process that is being initiated.
Constructing a Process Flow Diagram
The best way to create a process flow diagram is the old fashion way – in a team meeting with those closest to the process. You want the people doing the work in the process to create the process flow diagram. All you need is flip chart paper, post-it notes, tape, and markers.
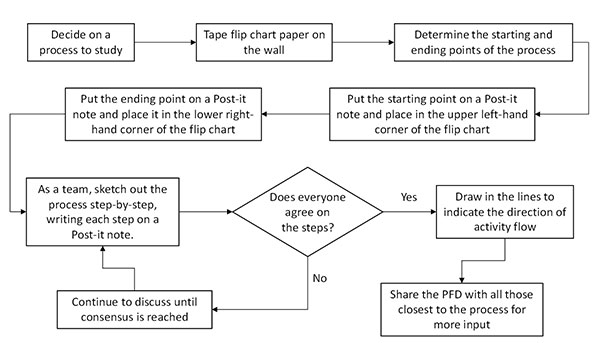
The steps in constructing process flow diagrams are given in Figure 2. First, decide on a process to study. Remember, any process improvement effort should include a process flow diagram for the process. Tape the flip chart paper up on the wall. This allows everyone to see the process flow diagram as it is developed. Begin by defining the starting and ending points of the process. This sets the boundaries for your process. Remember, you are using the process flow diagram for process improvement. Don’t make the boundaries too large. This makes it more difficult to focus. Put the starting point on a post-it note in the upper left-hand corner of the flip chart paper. Put the ending point on a post-it note in the lower right-hand corner of the flip chart paper.
Figure 2: Steps in Constructing a Process Flow Diagram
Then begin to create the process flow diagram by writing each step on a post-it note and putting it on the flip chart paper. Do not draw lines on the flip chart paper yet.
Post-it notes really facilitate this process. You will often get 4 or 5 steps into the process, and then a team member will remember a “loop” or a step that was left out. The post-it notes make it easy to add the forgotten step or loop. Simply move them around. This is also why you don’t draw lines on the flip chart paper as you are creating the process flow diagram.
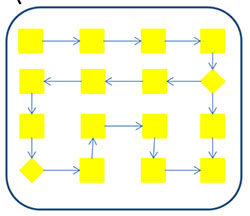
Each detail step of the process is written on a separate post-it note and then placed on the flip chart paper. Figure 3 shows the only two shapes you need to do a process flow diagram. Steps are placed as boxes; decisions are places as diamonds. On the diamond, you can put a “Y” in one corner for the “Yes” path, and a “N” in the another corner for the “No” path.
Figure 3: Basic Shape for Process Flow Diagrams
Be sure that everyone agrees on the steps in the process. Continue discussion until consensus is reached. Share the process flow diagram with everyone who is closest to the process. Make any additional changes as needed.
Once your team reaches agreement on the steps of the process, you just draw in your lines as shown in Figure 4 below. You can then use scotch tape to tape now the post-it notes so they don’t fall off the flip chart paper.
Figure 4: Process Flow Diagram with Post-it Notes
When creating a process flow diagram, it is critical that you include the small steps in the process. Make your process flow on a “micro” basis rather than a “macro” basis.
Process Flow Diagram Examples
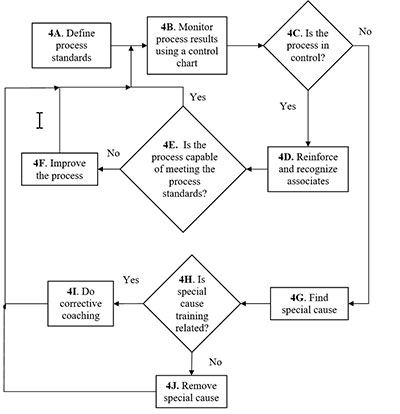
A couple of simple process flow diagram examples are given below. Figure 5 is the process flow diagram for managing a process. It comes from the fourth step of our Process Management Model. Prior to this step, key process indicators (KPI) have been selected. For each KPI, the process standard (or goal) is set. The results are then monitored using a control chart (not a monthly report or scorecard). The first goal is to get the process in control. Only then can you determine if the process is capable of meeting the process standard.
Figure 5: Managing a Process
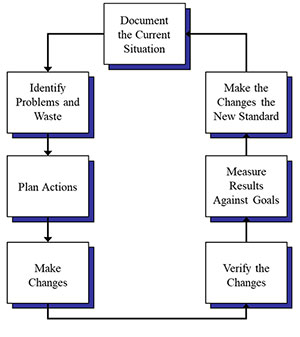
Figure 6 is a process flow diagram for Kaizen event. Note that it goes counter-clockwise. Remember with a kaizen event you are trying to minimize analysis and maximize action. You start by documenting the current situation.
Figure 6: Kaizen Process Flow Diagram
Then you can identify problems and waste (cause and effect diagrams are great tools for this). You then plan actions to reduce the problems and waste, and make and verify those changes. You then document the situation with the changes made – measurement is key here. Then you make the changes the new standard and start over.
Summary
This publication introduced process flow diagrams. A process flow diagram is a detailed picture of a process. It has many uses. It is a great technique for determining where a process should be measured. It also provides consensus on the what the steps on the process are. They usually highlight problem areas to work on improving. If you are working on a process problem, one of the first steps should be to draw a process flow diagram.

You state that "If a process flow diagram does not have a single decision point (a diamond), then it is probably not a true process flow diagram."Where is the decision point in your Kaizen Process Flow Diagram?
Ha! I actually thought about that when I put that example in! Of course, lots of decision points within each box.
Thanks, I want to automate process of my area.