February 2026
 SPC stands for Statistical Process Control. So, do you have to know statistics? That thought can easily scare people away right off the bat. But you don’t have to know statistics. Over the years, SPC has gotten much easier with software.
So, what do you need to know to use SPC? Basically, you need to be able to look at a picture of your process and, based on what you see, take action on the process or leave it alone.
In this publication:
- What about the statistics behind SPC?
- What is SPC?
- One Thing to Understand: Specifications vs Control Limits
- One More Thing to Understand: Avoid Tampering
- Three Types of Signals
- Process Improvement
- The Final Takeaway
- Quick Links
Please feel free to leave a comment at the end of the publication or download a pdf copy of it at this link.
What About the Statistics Behind SPC?
I was introduced to SPC back in the early 1980s. Dating myself here. In these “early” days, we relied on calculators to compute the averages, ranges, control limits, sigma, etc. Even earlier days relied on hand calculations. This made SPC time consuming – plus you saw all the formulas. And there were large opportunities for arithmetic errors. You had to focus on the mathematics.
All that has changed now with computers and software. This software does all the calculations for you. This has allowed SPC users to focus less on the math and more on what SPC is supposed to be used for.
We can put the math aside. The software handles that for us. The good news is that you don’t need to love math and statistic – or even understand much of it – to use SPC effectively.
Our SPC for Excel software handles all the calculations for you directly in Excel! Try the free 30-day demo now!
What is SPC?
The first thing to understand is what is SPC about. It is not about formulas. It is about distinguishing process noise from signals. This is what you need to know to understand SPC.
- Everything varies.
- There are two types of variation:
- Common causes of variation: these are the noise in the process -the normal variation – always present in the process.
- Special causes of variation: these are the signals in the process – something that is not normally there and not part of the way the process is supposed to operate.
- The only effective way to separate the two sources of variation is through the use of control charts.
- A control chart is a movie of your process – it shows what is happening in your process over time.
- Data from your process is plotted on the control chart in time-order – this allows you to see the variation in your process.
- The process average is plotted on the control chart – this allows you to see the variation around the average.
- The control limits are plotted on the control chart.
- The lower control limit is the smallest value you would expect from the process if the process just has common causes of variation present.
- The upper control limit is the largest value you would expect from the process if the process just has common causes of variation present.
- The control chart is then interpreted.
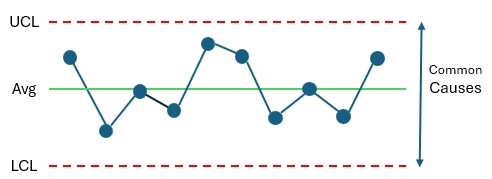
- If there are no points beyond the control limits and no patterns (like a long run below the average), the process just has common causes of variation present, and the process is said to be in statistical control. Figure 1 is an example of a control chart that is in statistical control
Figure 1: Control Chart for Process in Statistical Control
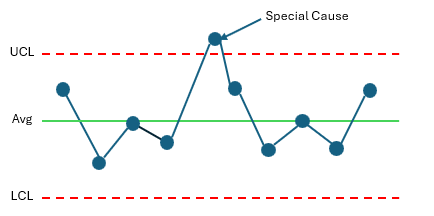
- If there are points beyond the control limits or patterns present, the process has a special cause of variation present, and the process is said to be out of statistical control. Figure 2 shows a process with an out of control point.
Figure 2: Control Chart for Out of Control Process
This started with everything varies. The question a control chart answers is:
Is this variation normal for the process or has something changed?
The wonderful thing about control charts is that a control chart will answer this question visually. A picture is worth a thousand words. If there is a signal, you should find out what causes the signal and remove it from the process. If there is no signal, don’t do anything. The process is working like it was intended to.
The key points about control charts is the following:
No Signal – Don’t Do Anything
Signal – Investigate What Happened
You can ignore all that statistical baggage. You don’t have to do any calculations. Your job in SPC is simply to interpret the chart!
One Thing to Understand: Specifications vs Control Limits
One thing that is very important to understand is the following:
Specification limits are not control limits
Control limits describe where the process is operating. Specification limits describe what customers or management want. Your process can be in statistical control but still make material that is out of specifications. All your product can be in specifications, but your process is out of statistical control.
A value that is out of specifications may not be a signal. A signal is only shown on a control chart.
The control chart answers the question “is the process in statistical control?”. Specifications answer, “is the process good enough?” Two different questions.
One More Thing to Understand: Avoid Tampering
There is a natural tendency to want to react to a single data point – to adjust the process to make it better. This can be very harmful to your process. If your process is in statistical control and you adjust, you are adding noise to the process – increasing the variation.
Only adjust the process if your control chart shows a signal and your investigation shows that you need to adjust the process.
Three Types of Signals
Control charts are used to separate the signals from the noise. There are three basic types of signals.
- Signal where you find the cause of the out of control point.
This is the ideal thing you would like to happen. You investigate the out of control point. You find out what caused it and remove the cause from the process. And the process returns to a state of statistical control. This is ideal. In practice, it is much more difficult to find the cause of the out of control point.
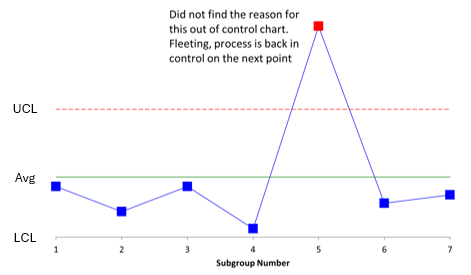
- A signal occurs but you don’t find the cause of the out of control point, but the process returns to a state of statistical control on the next point.
This is a fleeting special cause of variation. A signal occurs on the control chart, and you look for the cause of the variation, but you can’t find anything. The next point is back within control. The special cause is gone. You missed an opportunity to remove a special cause. Don’t worry, it will probably be back again to give you another chance. An example of this is shown in the figure below.
Figure 3: Fleeting Out of Control Point
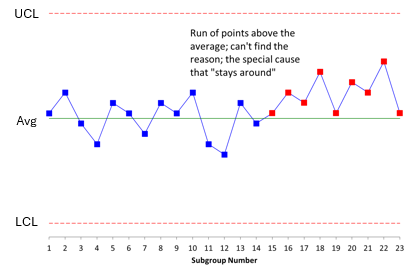
- A signal occurs but you can’t find the cause of the out of control point, but the process does not return to a state of statistical control on the next point.
The third type of special cause is the one that stays around, and you can’t find the reason for it, no matter how hard you look. Maybe you have a run above the average. This is caused by a special cause that remains – maybe something like a subtle change in a raw material. But it is still around; you just haven’t found the reason yet. You can’t find out what happened. What do you do now?
If the increase in average is not what you want, you may have to adjust your process to bring the average back down. That is not the “proper” thing to do but it brings the process back to where it was. The special cause is still around. If it goes away, the process may well reverse to where it was. An example of this is shown below.
Figure 4: Reason for Out of Control Not Found Example
Process Improvement
It may seem like you are improving your process when you eliminate special causes of variation. You are not. You are merely putting the process where it is supposed to be. Those special causes are not supposed to be there.
Process improvement can occur once the process is in statistical control. To improve a process that is in statistical control, you must fundamentally change the process. The key word is “fundamentally.”
If you process is in statistical control, but it is not performing where you want it to, you must change the process fundamentally.
The Final Takeaway
You don’t have to know statistics to use SPC. The software does that for you. All you need is an understanding of what the control chart is trying to tell you. It is a movie of your process over time. It will tell you when you need to take action because there is a signal present or when to leave the process alone because there are just common causes of variation, noise, present. So simple!
The SPC for Excel software handles all your control chart needs – from creating to interpreting the control charts!