July 2025
 You are getting ready to run a product on your line that you don’t run very often. This product always has problems with being on target. Or maybe you are making the first production run for a new product. You just read an article by Dr. Donald Wheeler on setting a process aim and you want to try it out. The steps you follow are given in this publication.
In this publication:
- Introduction
- The Process Aim Chart
- Out of Control Tests Used in Setting the Process Aim
- Example: Setting the Process Aim with Known Sigma
- Example: Setting the Process Aim with Unknown Sigma
- Summary
- Quick Links
Feel free to leave a comment at the end of the publication. You can download a pdf copy of this publication at this link.
Introduction
Quality is often defined as on target with minimum variation. Minimum variation occurs when your process is in statistical control, that is, it is predictable and consistent. Getting on target quickly can be difficult with batch processes and short runs. So, how can you get on-target in the shortest time possible? The process described below is intended to accomplish just that.
Suppose our process involves filling bags to a certain weight. There are three terms that we need to define: process target, process aim, and process average.
- Process target: The specific value that the process should generate, usually set by design specifications, customer requirements, or engineering standards. Suppose the process target for filling the bags is 40 pounds.
- Process Aim: This is the process is set up and controlled trying to achieve the process target. This includes machine setup and settings, operator training, etc.
- Process Average: This is the average result over time from the process, based on samples taken from the process. It may or may not equal the process target.
How does this process work? It is based on using control charts, but with the centerline being the process target and not the actual overall process average. Plotting points over time will tell you if the process average is close to the process target. If you have 10 points in a row with no out of control points, then you assume that the process average is close to the target.
The methodology described below is adapted from Dr. Wheeler’s article Setting the Process Aim Part 1.
The Process Aim Chart
The Process Aim chart is an individuals control chart with the process target as the centerline on the X chart. The Process Aim chart equations are the same as for the individuals control chart but with the target replacing X. So, the equations become:
UCLx = Target + 2.66R
LCLx = Target – 2.66R
where R is the average moving range, UCLx is the upper control limit and LCLx is the lower control limit. There can be a moving range chart associated with the Process Aim chart. In that case:
UCLr = 3.267R
where UCLr is the upper control limit on the moving range chart. You can then estimate sigma (s) as the following:
s = R/1.128
If you replace R with 1.128s, the above equations become:
UCLx = Target + 3s
LCLx = Target – 3s
UCLr = 3.685s
The Process Aim chart then has this look:
Figure 1: Process Aim Chart Layout
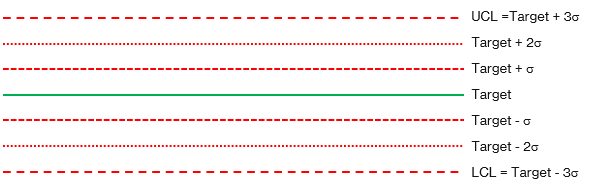
The extra lines (besides the target, UCL, and LCL) are for interpreting the zones tests as described next.
Out of Control Tests Used in Setting the Process Aim
There are four out of control tests used to help set the process aim. These are points beyond the control limits and the three zone tests (zones A, B and C). These are described below in terms of the Process Aim chart.
- Points Beyond the Control Limits: A single point beyond the Target ± 3s is a signal that the process average is significantly different than the target.
- Zone A Test: Two out of three consecutive points on the same side of the target value and outside the two sigma limits (Target ± 2s) is a signal that the process average is significantly different than the target.
- Zone B Test: Four out of five consecutive points on the same side of the target value and outside the one sigma limits (Target ± 1s) is a signal that the process average is significantly different than the target.
- Zone C Test: Eight consecutive points on the same side of the target is a signal that the process average is significantly different than the target.
These tests will be used to determine if the process aim must be adjusted. The process aim will be adjusted when there is a signal that the process average is significantly different than the target.
Example: Setting the Process Aim with Known Sigma
Suppose we have a product that has short production runs. It is important to get the process aim as close to the target as possible in a short time frame. The process target is 100. This is not the first time you have run this product, and you have a historical value for sigma. The value of sigma is 3.5. If you don’t have a historical sigma, you will need to estimate the value of sigma. This is discussed later.
You can use the target and sigma values to create the Process Aim chart as shown in Figure 2. The zones for the out of control tests are also shown.
Figure 2: Process Aim Chart
![]()
You are now ready to start the process and take samples over time. The data used in this example is shown in Table 1. Note that it is not used all at once.
Table 1: Data with Known Sigma
|
Sample |
X |
Sample |
X |
|
|
1 |
102 |
8 |
104.9 |
|
|
2 |
108.5 |
9 |
102.3 |
|
|
3 |
109 |
10 |
91.5 |
|
|
4 |
92 |
11 |
97.1 |
|
|
5 |
100.1 |
12 |
104 |
|
|
6 |
105.1 |
13 |
99.8 |
|
|
7 |
95.6 |
The first sample you take has a measured value of 102. This is in Zone C between the target and +1s. No indication that the process average is different from the target. The second sample has a value of 108.5. This is in Zone A between +2s and +3s, close to out of control, but there is no signal yet of being off target. The third value is 109. This is in Zone A. You now have an out of control situation: 2 out of 3 consecutive points in Zone A or beyond. The first three points are shown in Figure 3.
Figure 3: First Three Points on the Process Aim Chart
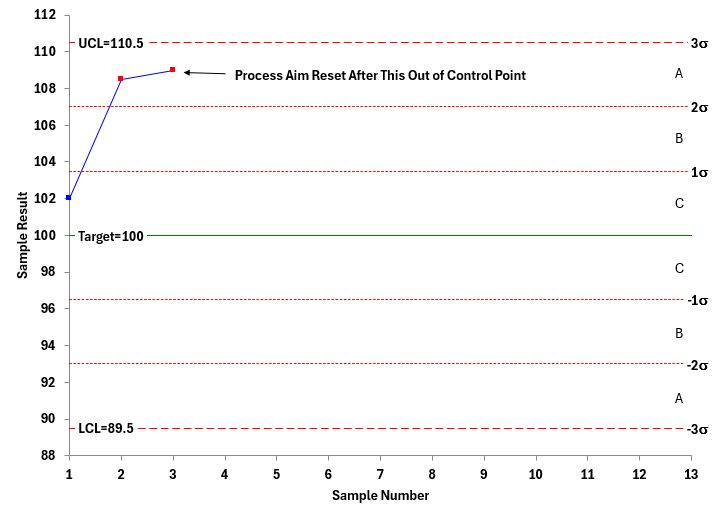
Since the chart fails the test for Zone A, the process average is not at target. You must adjust the process aim. The average of the first three points is:
Average of First Three Points = (102 + 108.5 + 109)/3 = 319.5/3 = 106.5
The process aim needs to be adjusted by 106.5 – 100 = 6.5. So, whatever knobs that are used to adjust the process aim are changed to decrease the process aim by 6.5. Data then continues to be collected.
The objective is to obtain 10 points in a row where there are not any out of control points. Then you can assume that the process average is on target. If there is a signal that there is another out of control point, the current process average is calculated using the data since the last out of control point. The process aim is adjusted to reflect how far the current process average is off target.
Suppose the next 10 points are as shown in Figure 4.
Figure 4: Process Aim Chart with Additional Data
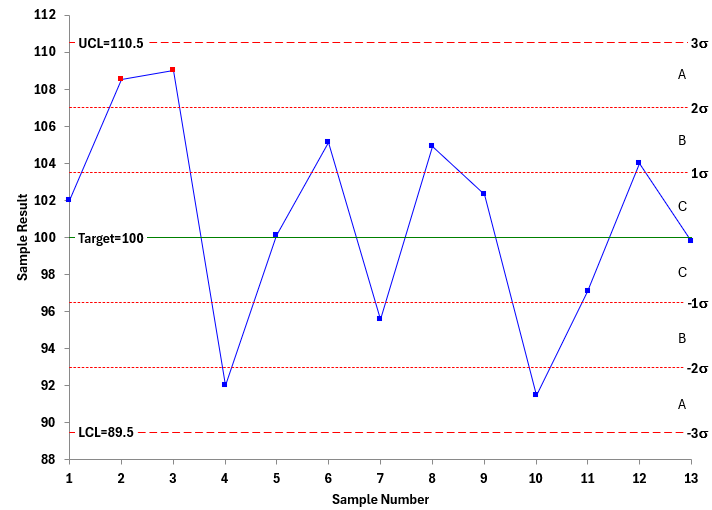
These ten points are in statistical control. The process average is on target. From this point on, you monitor the process for statistical control using the sampling system you normally use.
Setting the Process Aim with Unknown Sigma
Suppose our product is a new product. You know the target for the new product, but you don’t know the value of sigma. In this case, you must collect data from the new process to estimate the value of sigma. The data used in this example is given in Table 2.
Table 2: Data with Unknown Sigma
|
Sample |
X |
Sample |
X |
|
|
1 |
102.1 |
10 |
100 |
|
|
2 |
104.5 |
11 |
101.3 |
|
|
3 |
100.3 |
12 |
95.7 |
|
|
4 |
103.8 |
13 |
100.8 |
|
|
5 |
102.6 |
14 |
105 |
|
|
6 |
103.5 |
15 |
101.2 |
|
|
7 |
100.4 |
16 |
101.7 |
|
|
8 |
100.8 |
17 |
98.9 |
|
|
9 |
97 |
18 |
97.1 |
Here are the general steps.
- Take ten samples from the process, measure the value of each and calculate the moving ranges.
- Plot the sample results on the X chart with the target value added only. The only test to apply to the X chart at this point is a run of 8 consecutive points on one side of the target. If there is a signal, calculate the process average of the 10 points and adjust the process aim based on the difference between the process average and the target. Figure 5 shows an example of this.
Figure 5: Process Aim Chart with Unknown Sigma
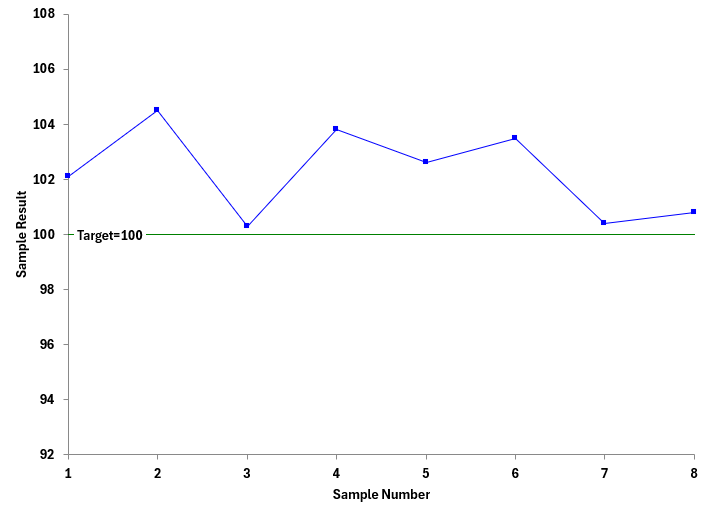
Note that the first 8 samples are above the target. A signal has occurred already. No reason to pull an additional 2 samples with the current setting. Since you have a signal, the process aim should be changed. The average of the 8 samples is 102.25. The process aim is adjusted to decrease the process average by 102.25.
- Plot the moving ranges on the mR chart as shown in Figure 6.
Figure 6: Process Aim Moving Range Chart
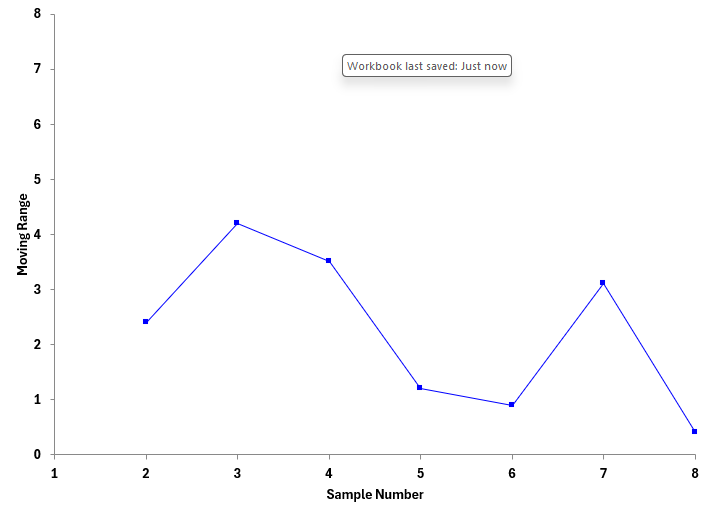
Note that the mR chart has no average or control limits. After you have collected the data, calculate the average moving range and then calculate sigma. The average moving range is 2.24. Sigma is then R/1.128 = 2.24/1.128 = 1.99. We will use sigma = 2.
You can now calculate the UCLr for the moving range chart as well as the UCLx, LCLx, and 1 and 2 sigma limits on the X chart.
- Now you continue collecting data. Assume you collect ten more samples and plotted the X values and moving range values on their respective charts. Figure 7 is the updated X chart.
Figure 7: Process Aim Chart Updated
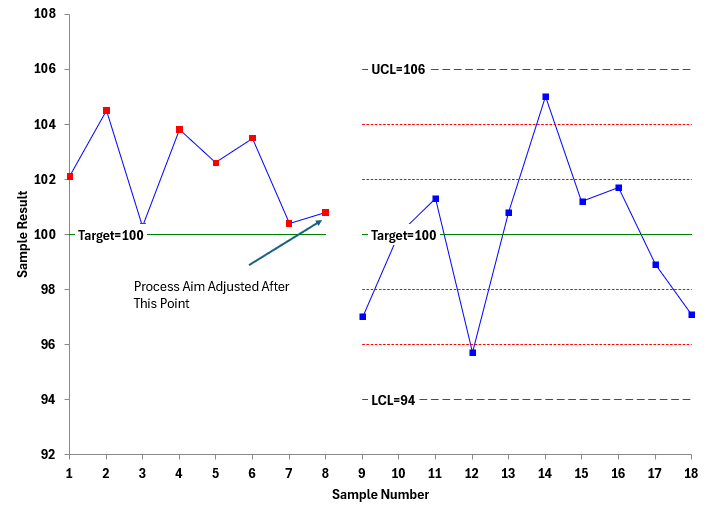
The next ten points are in statistical control. There are no signals. The conclusion is that the process average is on target.
- You also plot the moving ranges from the 10 points. Figure 8 shows the moving range for the Process Aim chart.
Figure 8: Updated mR Chart for the Process Aim
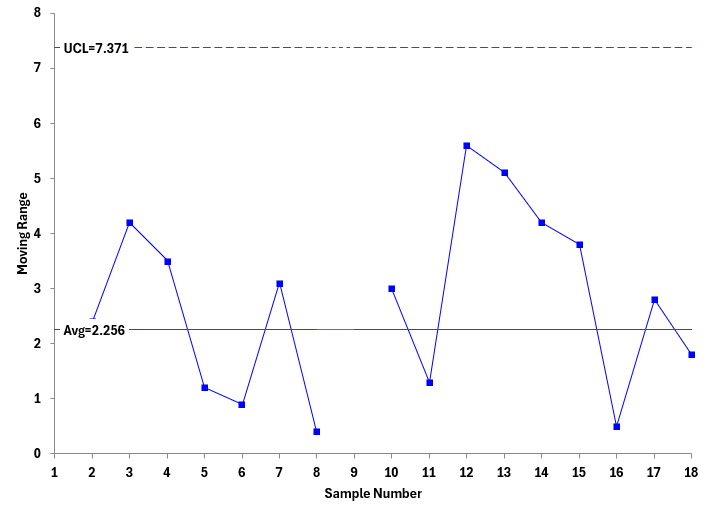
This chart uses the average and control limits from the first set of points. This chart is in statistical control. So, both charts are in statistical control, meaning that the process average is operating on target for the process aim. The production run can start.
- You are not quite done at this point. The control limits on the Process Aim chart are based on the value of sigma. The sigma value used in the last two charts was based on the first eight points. This is really not enough data to give you a good estimate of sigma. You need more like 16 values to estimate sigma. To accomplish this, you can use the 18 values in the moving range chart to determine the final sigma. You don’t include the moving average where the process aim was changed.
The remaining moving ranges give an average of 2.7375. Dividing the average moving range by 1.128 gives a value of sigma = 2.4269. You can calculate the new control limits by the following:
UCL = 100 + 3(2.4269) = 107.2807
LCL = 100 – 3(2.4269) = 92.7193
These become the control limits to monitor future production .
Summary
This publication looked at how to set a process aim for a process with a known sigma and an unknown sigma. The process involves using the process target as the center line on the control chart and judging if the process is on target or not. Tests for out of control points are used to determine this.