September 2017
(Note: all the previous SPC Knowledge Base in the process improvement category are listed on the right-hand side. Select this link for information on the SPC for Excel software.)

In this publication, we will look at how we spend our time at work. This time can be divided into four major categories: value-added work, necessary work, unnecessary work, and not working. In which category do you think a typical company spends most of its time? Unfortunately for most, it is the last two categories of unnecessary work or not working. And these two categories are directly related to the seven types of muda: overproduction, waiting, unnecessary transportation, unnecessary processing, too much inventory, unnecessary movement, and making defective parts.
Reducing waste and improving where we spend our time improves processes – and the bottom line. In this publication:
- A Simple Muda Example
- Unnecessary Work and Not Working – What a Cost!
- The Unnecessary Work – Muda!
- Attacking Muda
- Summary
- Quick Links
Please feel free to leave a comment at the end of the publication. You can download a pdf copy of this publication at this link.
A Simple Muda Example
In a distribution company, “production” means getting items shipped in the right quantities to the right destination at the right time. A distributor of general industrial supplies utilized a very straightforward and apparently very simple picking process to help do this.
Essentially, their picking process went like this: Pickers in the warehouse would pick the items printed on a pick ticket, put them in their pick basket, and take the basket – with properly picked items — to the packing table. The next pick ticket would be printed, and the picking process would proceed again. Now in this warehouse, the pick ticket printer was on the opposite side of the building from the packing table. This was, of course, by design, because that’s where the supervisor’s office was. With the process set up this way, the supervisor could review the pick tickets without walking all the way across the warehouse. However, the supervisor never did anything with the pick tickets except review them.

As usual, metrics really bring this story to life. The printer was about 150 feet from the packing tables. There were five pickers who averaged picking 40 pick tickets per day so the total distance the pickers walked just to retrieve pick tickets was 150 x 5 x 40 = 30,000 feet. At 5,280 feet per mile, this means that the pickers were walking an extra 5.7 miles per day. Good for their health, but poor for the productivity of the warehouse. The pickers became “lean” but not the company. To reduce process cycle time and increase warehouse productivity, the printer was moved next to the packing table. So simple!
Unnecessary Work and Not Working – What a Cost!

This anecdote, of course, is not exceptional. Costs and their attendant wastes occur throughout organizations. No one is exempt, and, since costs occur throughout the organization, so should lean thinking. “Lean” is a frame of mind as much as it is a methodology. Lean thinking represents the continual asking of the question:
“How can we do more and more with less and less?”
The link between excessive cost and lean processes is muda. Muda represents anything that utilizes resources but does not create value. How much of your day is spent on activities that create value? According to William Conway in Winning the War on Waste, all employees’ time on the job can be divided into four major categories: Value-added work, necessary work, unnecessary work, and not working. Leaders would like to think that they and their employees spend most of their time on the value-added and necessary work. However, that is often not the case.
Actually, employees spend most of their time doing “unnecessary work.” Anyone can conduct an easy experiment to see if this is true. At some random time during the day, simply walk out to the shop floor or into the office. What percent of the employees that you see are doing something that creates value to the customer? Do this several times a day over the next week. What do you think the average percentage will be? If your company is typical, the average amount of time spent actually doing value-added work will be around 20%!
Think that is too low? Here are the operational definitions of each of the four categories. Take these definitions and walk the floor; it will be an eye-opening experience.
Value-Added Work: This is work that creates value for the customer, regardless of whether the customer is willing to pay extra for it or not. For example, entering a customer order over the telephone is value-added work. Other examples would include making a sales call, working on reducing cycle time on a process, or working with a customer to solve problems in their processes.
Necessary Work: This is work that is required to help run the company but does not add value for the customer. Most Human Resource processes, for example, do add value to the employee (internal customer), but do not directly add value to what the external customer receives. Other necessary work includes holding safety meetings, preparing budgets, planning, and cycle counting. All of these activities help the company, and are even necessary at some level, but they provide nothing that the customer directly values.
Unnecessary Work: The major source of unnecessary work is rework – doing something over again because it wasn’t done right the first time. Examples include correcting time cards, correcting expense reports, checking someone else’s work, and reworking a defective product. Steps in a process that have become obsolete are another example of unnecessary work. Sometimes steps are added to a process to account for a given situation, but when that situation no longer exists, the additional steps are not removed from the process.
Not Working: This is just what it says – time spent not working. Sometimes it involves talking to other employees about Monday Night Football or about the latest blockbuster movie. Sometimes it is the old office politics that is being discussed or talking about personnel business on the phone. There will always be some time spent not working, but leaders are often surprised at how much time this really takes up.

Oh, you say work was being done during that time? Talking to other attendees about the business at hand? OK. We’ll give you partial credit for that. Most of the time spent waiting for a meeting to start is spent socializing over a cup of coffee. But, let’s say you only spend 20 minutes of the 45 minutes “not working.” This 20 minutes per week represents 20 x 50 working weeks per year = 1000 minutes. This represents 16.7 hours per year not working, just waiting on meetings to start. Over two days just because you don’t start meetings on time! Trivial example, you say. Now multiply the 16.7 hours per year by the number of people who regularly attend meetings. If there are fifty people, then 16.7 x 50 = 835 hours. Over 20 weeks of time (almost one half of a full-time position) just waiting for meetings to start on time!
This category also includes the time “not working” that is built into the system by management. For example, many companies give employees a fifteen-minute break in the morning and again in the afternoon. For an 8 hour day, the time spent not working that has been set up by management is 0.5 hours/8 hours = 6.25%. Still others pay for a thirty-minute lunch. Now the time spent not working is 1 hour/8 hours = 12.5%. So, management has set up a system that automatically generates a significant amount of time that is spent getting paid for not working.
“Entitled” breaks and lunches are not the major source of not working time. The major causes of not working are personal habits, lack of direction, and poor supervision. The point is that, in most organizations, more time is spent “not working” than is spent on “value added work.”
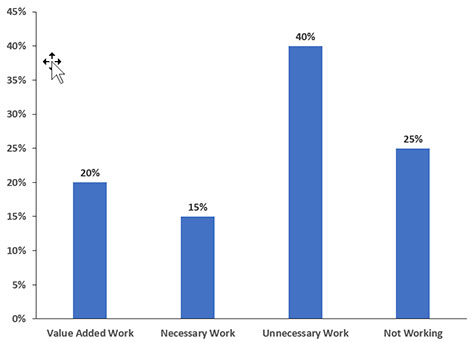
On the average, what percentage of time is spent by employees in each of the four categories? Consider Figure 1 (adapted from Conway’s Winning the War on Waste). In a typical company, only about 35% of the time is spent on valued-added and necessary work. The opportunity for improvement is huge–as is the cost!
Figure 1: Time Spent by Employees
Time and time again, the data fit this pattern. In one company, a service department was responsible for implementing quality improvement processes throughout the company. The four people in the department collected data on their activities by writing down what they were doing at random times four times a day. Over time, their analysis of the data showed they were spending 35% of their time on rework (unnecessary work).
The only way to become lean is to go after the unnecessary and not working categories. They represent most of the muda in the processes. Now, this does not mean that a company should ignore the necessary work that does not bring value to the customer. For example, reimbursing expenses to employees is very important. It is necessary work. But there may be more effective and more efficient means of reimbursing expenses; opportunities to actually help a company reduce costs.
The Unnecessary Work – Muda!
Taiichi Ohno developed the Toyota Production System, which introduced us to several models for optimizing manufacturing processes, including “Just In Time” and Kanban. Mr. Ohno defines seven sources of muda (Toyota Production System, Beyond Large-Scale Production, Taiichi Ohno):
- Muda of overproduction
- Muda of time on hand (waiting)
- Muda in transportation
- Muda of processing itself
- Muda of inventory
- Muda of movement
- Muda of making defective products
Womack and Jones added an 8th source of muda: Goods and services that don’t meet the needs of the customer (Lean Thinking, Banish Waste and Create Wealth in Your Corporation, James P Womack and Daniel T. Jones). Before discussing various ways to attack muda, and therefore costs, let’s examine these sources of muda in more detail for both manufacturing and service. Each of these is related to the two categories of unnecessary work or not working at all.

Can you ever overproduce in service organizations? Can you provide too much service? Of course, and with the same harmful effects as in manufacturing. For example, some fancy restaurants believe they are providing excellent service if they have a cadre of waiters ready to spring to attention anytime your water glass is less than 80% full. For some customers, this type of environment interrupts their desires to consume good food and converse with good friends.
Sometimes the muda of overproduction is not obvious. For example, one heat-treater hardens and tempers steel tubes to the proper physical properties for its customers. The customers often deliver and pick up their own material. One of their customers often leaves the heat-treated tubes at the heat-treater’s location for several months. The heat-treater has already run the material through the treating process. Time and material have already been spent on the tubes. Now the finished tubes sit in the shipping bay waiting to be picked up by the customer. This is simply another form of muda. The heat-treater’s cost of doing business with this customer is greater than with other customers.
These days it is common practice to want to “exceed” customer expectations – providing more than the customer expects. Sometimes – even most times — this is good; but not always. Exceeding customer expectations usually costs something, and over time, the customer begins to believe he or she is entitled to the extra service. former “carrier of choice.”

Transportation: Moving items around is part of every manufacturing process. If you do not move the items, they won’t ever get out the door. The problem is that this movement, in and of itself, usually does not add any real value to the product. As we already noted, the movement itself is a necessary element in the process, but in most processes, there is way too much movement, which constitutes unnecessary work (Remember our little story about the pickers?). To illustrate: Many processes are still done in “batches.” A load of steel tubing is heat treated to produce the required physical properties. After heat-treating, the entire load is then moved to the straightener to be straightened tube by tube. Then the load is moved to the saw for each tube to be cut to proper length. From the saw, the load goes to the stenciler so the proper information can be stamped on each treated, straightened, cut-to-length tube. Finally, the load is inspected and baled for shipment.
Each movement in the above illustration requires that the load be picked up with a crane and moved to a different location. More importantly, after each movement is an unload/reload step. The material is unloaded and reloaded at least four times during the process. Moving the load from spot to spot may be necessary in order to get the work done, but doesn’t really add anything of value for the customer. In fact, movement generates lots of opportunities for problems to occur. Products can be damaged or scratched; paperwork accompanying the load can become dirty or lost; and people can get hurt during unloading and loading. So, when you see product or paperwork being moved, you are probably witnessing an opportunity to reduce muda.
Processing: It is a simple fact of life that many of us work in processes which contain steps that, for one reason or another, are not needed. Yet we continue to “work” those steps, because 1)”This is the way it’s always been done”; 2) “This is the way Mike did it when he had this job”; or 3) “This is the way I was trained (i.e., told) to do it.” If the steps are indeed not needed, then we are doing unnecessary work. There are a number of ways to identify unneeded process steps, and we’ll get into some of them later, but the “classic” unneeded step is the one involving checking work that has already been done. Such steps are (or should be) unnecessary. For example, a manufacturer once loaded the wrong material on a truck going to a customer’s plant. The reason that the mistake occurred was that the loader failed to check the paperwork properly. So, the manufacturer changed the process by adding a step which required that a supervisor check the shipping paperwork before the loader loaded the material. This step not only adds no value, but also represents unnecessary work. Instead of adding a “check step” to the process, the manufacturer should have figured out how to make the process mistake-proof.
Inventory: Inventory refers to any final product, work-in-progress, or raw materials that are not being used (just stored for future use). This represents another form of unnecessary work – using resources without adding value. Producing a product and placing it “in stock” (taking up space) does not add value. High inventory levels are the result of overproduction, and as such can be utilized to quantify the amount of unnecessary work that is being done (in this category). Material is put into storage where it sits. It can be damaged in storage or can deteriorate and become unusable.
We recognize that high inventory levels tend to make people (particularly salespeople) comfortable. The sentiment goes something like, “We have it ready when the customer orders it.” “We have a backup supply in case a machine goes down.” But we also suggest that high inventory levels make it easy for those “comfortable” people to ignore the very real problems that lead to the need for those high levels; problems which will ultimately have to be addressed. These problems include such things as quality issues, poor production rates, employee issues (e.g., absenteeism), and poor maintenance.

In one plant, a kaizen effort was underway to reduce the time to setup a forging machine. Initial data collection showed that the operator walked over two miles to find the material he needed for the setup. All during this time, the machine was not operating. This is muda. In order to reduce costs, you want the operator working on the setup, not looking for material he needs. You want the setup time to be minimal.
Defective Parts: Reworking defective parts is the easiest muda of all to understand. Any work required to fix or even scrap a defective part is unnecessary. When an entire part must be scrapped, the cost of producing one good part is double what it would normally be. Needless to say, a company wouldn’t last long if it had to make two parts to get one good part. Rework is always considered “unnecessary,” and every defective part or service adds cost to the bottom line. A part that has to be reworked or scrapped has both time and material cost invested. Extra time is invested every time a service must be re-delivered.
Customer complaints can be considered “defective parts” since time has to be spent resolving the complaint. In this same vein poor training is double muda because it produces a “defective,” i.e., an untrained employee, and is essentially wasted time muda.
Attacking Muda
One of the quickest ways to attack muda is through the use of kaizen events. A kaizen event is usually a week-long event and focuses on two major areas: solving manufacturing (or office) problems and eliminating process waste. Kaizen events are problem solving events. A team is formed to run the event. But the entire plant supports the team. This means that anything the team needs, they get as soon as possible. For example, if a team wants a machine moved from point A to point B, maintenance gets it done immediately. The team has priority during the kaizen event.
A kaizen event involves finding the problems in the process, determining what causes the problems, agreeing on potential solutions and then implementing those solutions. It is basic problem solving – however, it is really turbo problem-solving because the cycle is repeated each day – maybe multiple times.
The following is true of kaizen events:
- A team approach is used.
- There is a lot of activity in a short time frame.
- All support groups (maintenance, engineering, lab, etc.) are available to help at a moment’ notice.
- The emphasis is on action – not in-depth analysis.
- The progress of the team is reviewed daily.
- The goal is to achieve flow in a process.
More information can be found in our publication on kaizen and SPC.
All employees can contribute to reducing muda day and day out by being aware of what causes muda and being committed to reducing the impact muda has on our processes.
Summary
In this publication, we examined at how we spend our time at work. This time can be divided into four major categories: value-added work, necessary work, unnecessary work, and not working. We spend most of our time in these two categories: unnecessary work or not working. And these two categories are directly related to the seven types of muda: overproduction, waiting, unnecessary transportation, unnecessary processing, too much inventory, unnecessary movement, and making defective parts. The seven types of muda were defined.

A figure can be helpful to represent the picking process.
There is a process flow diagram for the picking process at this link:
https://www.spcforexcel.com/knowledge/control-chart-examples/spc-process-improvement-warehouse
I think you are being very generous with your definition and % on typical Added Value work. About 10 years ago I believe Toyota felt their figure was 8% value add after 50 years of work, I'd be really surprised if any manufacturing organisation was north of 10%.I did some figures for our company (we are profitable) and if you include our current lead time our value added % was 0.26% ;-)Given we are making money we have plenty of scope to make more!