In this issue:
- Impact of Measurement Systems
- Accuracy and Precision
- PFD for Monitoring a Test Method
- Example
- X Chart
- mR Chart
Collecting and analyzing data are a vital part of process improvement. It is important to be sure that the data we are collecting are accurate and precise. If not, we may not be able to see the effect of improvements we are trying to make in the process. In addition, we may be looking for a special cause in an operating unit when the real cause is in the measurement system.
There are many types of measurement systems. SPC was originally developed for the production of widgets. Measurements in these cases often involve dimensions. These types of measurements can be very precise and accurate. However, this is not true for all types of measurements. For example, in the process industries, there are many types of measurement systems. These include temperature and pressure gauges/indicators, on-line analyzers, wet chemical techniques and physical test methods. Some of these measurement systems are not very accurate or precise. This month’s e-zine defines accuracy and precision and provides a process for monitoring a test method over time.
Impact of Measurement Systems
 We rely on measurements to tell us when our process is operating correctly, when there is a problem, or when we have made an improvement. When we take a measurement, we often assume that the measurement result is the “true” value of our sample. Unfortunately, this is not true. Measurement systems, like any other process, are subject to variation. You will not always get the same result, for example, when you run a sample again or take another temperature measurement. The following examples illustrate two ways the measurement system can impact a process.
Suppose you are an operator in a processing unit. You have started a control chart on a certain product parameter. This parameter is determined by a lab test method. Suppose the last point you plotted is above the upper control limit. This means there is a special cause present in the process. Your responsibility is to begin looking for the cause. Where do you start? There are many sources of variation present in a process. A control strategy helps you determine what to look for. The cause could be due, for example, to a change in raw materials or a sudden drop in the outside temperature. You begin to look for the cause. This takes time.
What about the test method? Is it possible that the special cause was due to something occurring in the test method and not in the processing unit? The answer to this is yes. It is possible that the test method did not reflect an accurate value for the product parameter. If this is the case, you will spend a lot of time looking for the special cause in the processing unit when the real cause was in the test method. Thus, test methods can produce special causes in the process.
Now suppose you are an engineer. You have determined some process changes that should increase the amount of one component in a process stream. The operating unit makes the process changes and samples are taken to the lab for analysis. Is the test method good enough to “see” the improvement caused by the process changes? If not, you will not be able to determine what impact the process changes had. Worse, you may make a wrong judgment about what impact the process changes had. Thus, test methods with a lot of variability may mask process improvements
Test methods must be accurate and precise. These two terms are defined below.
Accuracy and Precision

Accuracy refers to the absolute correctness of the measurement system relative to a standard. There are many standards. For example, one method of checking the accuracy of a laboratory weigh scale is to put a standard 10 gram weight on the scale. On average, the scale should read 10 grams if it is accurate.
Another example involves an on-line gas analyzer. To check the accuracy of this analyzer, a standard gas is injected into the analyzer. On average, the analyzer should indicate the standard gas composition if the analyzer is accurate. Obviously, we want test methods that reflect the true value of a standard.
Precision of a test method refers to how reproducible or repeatable the results are. How close will the results be if a sample is rerun or a temperature is re-measured? Consider the test method example. If a control or standard is run multiple times, how different will the results be? This variation in reproducing the result is called the precision of the test method. The smaller this difference, the more precise the test method.
The figure above presents another method of developing an understanding of accuracy and precision. The objective is to hit the target’s bull’s- eye. The figure labeled 1 shows a marksman who is precise and accurate. Each shot hits near or in the bull’s-eye (i.e., the marksman is accurate). The difference between successive shots is small (i.e., the marksman is precise).
The figure labeled 2 above shows a marksman who is accurate but not precise. If you average all his shots, the average would be close to the bull’s-eye. However, the difference between shots is very large.
A marksman who is precise but not accurate is shown in the figure (3). His average shot is not near the bull’s-eye. However, the difference between consecutive shots is very low.
Last, the figure (4) also shows an example of a marksman who is neither accurate nor precise. There is no telling where the next shot will end up. He is off the bull’s-eye and the differences between shots are very large.
PFD for Monitoring a Test Method
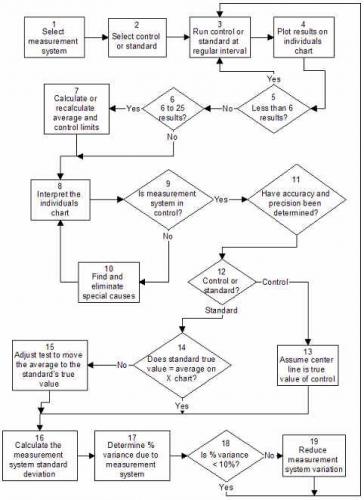
The process for monitoring the accuracy and precision of a test method is given in the process flow diagram above.
As mentioned before, test methods, like all measurement systems, can be viewed as a process. As such, test methods have common and special causes of variation. Control charts can be used to monitor the accuracy and precision of test methods.
The procedure for determining the accuracy and precision of a test method is given below.
- Run a standard on a regular basis.
- Plot the results using a control chart.
- Bring the test method into control by finding and eliminating special causes.
- Determine the accuracy of the test method by comparing the center line on the individuals chart to the “true” value of the standard.
- Determine the precision of the test method by calculating the standard deviation of the test method from the range chart.
- Determine the percent of total variance due to the test method.
- Continue to monitor the accuracy and precision of the test method over time.
An example using this procedure is given below.
Example
To understand the steps in this procedure consider the following example. A test method is used to measure the amount of moisture in a resin. To determine the accuracy and precision of the test method, a control was selected. This control contained about 0.12 wt% water. The true value of the amount of moisture in the control is not known. The steps in the procedure for determining the accuracy and precision of this test method are given below.
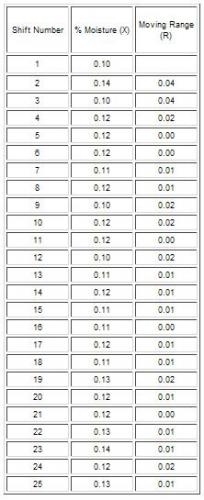
Step 1: Run a standard on a regular basis.
The resin control is tested once per shift for moisture content. The results are recorded. The data are given below.
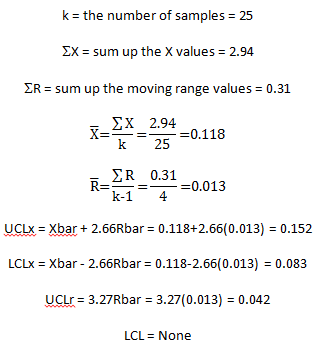
Step 2: Analyze the results using a control chart.
The individuals control chart is selected for this test method. The calculations for the averages and the control limits are shown below. The control chart is shown after this section.
Step 3: Bring the test method into statistical control by finding and eliminating special causes.
As can be seen in the figure, the range chart is in statistical control. However, the X chart is not in statistical control. The last seven points on the X chart are above the average. This means that there is a special cause present. Something has happened that caused the average to increase. When this occurs, the test method should be treated as if something is mechanically broken. No more samples should be run until the reason for the out-of-control point has been found and eliminated. Control strategies should be used to help find the reasons for out-of-control points. It may be that the instrument needs to be re-calibrated. There are many other reasons that the test method could be out of control.
Step 4: Determine the accuracy of the test method.
To determine the accuracy of the test method, the center line (Xbar) on the X chart is compared to the true value of the standard. The test method must be in control before this can be done. If Xbar does not equal the true value of the standard, adjustments must be made to the test method to shift the average to the true value.
In this example, the test method is not in control with respect to X. If it were, the average could be compared to the true value of the standard. However, in this case, the true value of the moisture content of the resin sample is not known. We simply assume that the average is the “true” value and monitor the test method versus this average in the future. Again, the chart must be in control before making this comparison. The following definition for an accurate test method is based on using an individuals control chart.
An accurate test method is defined as a test method that is in statistical control with respect to the average of the standard (i.e., the X chart) and the center line of which (Xbar) on the X chart is equal to the true value of the standard.
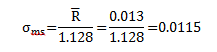
Step 5: Determine the precision of the test method.
To determine the precision of the test method, calculate the test method standard deviation, sms, from the average range on the range chart. This is a measure of the amount of variation between the individual results. You can view the standard deviation as an average distance each individual result is from the average. The larger the standard deviation, the greater the variation.
What causes variation between the individual results? The same standard is being used all the time so this does not cause variation, unless the standard changes. The variation is caused by the test method itself (including different technicians). The range chart must be in statistical control before you can calculate this standard deviation.
For this example, the range chart is in control. The estimate of the test method standard deviation is then:
Step 6: Determine the percent of total process variation due to the test method.
The total process variation can be divided into three major components: the process variation itself, the sampling variation and the test method variation. These three components of variation are related by the following :
![]()
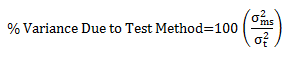
Note that the relationship is linear in terms of the variance (which is the square of the standard deviation), not the standard deviation. The percent variance due to the test method is then given by:
To determine this percent, some estimate of the total variance is required. The best estimate would be from a range chart kept on the quality parameter (in this case, moisture content) in the operating unit. If the operating unit is not keeping a chart on the quality parameter, you can take a month’s worth of data from the unit and calculate a variance.
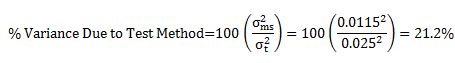
Assume that a control chart has been kept in the operating unit. The standard deviation, st, has been calculated from the average range to be 0.025. In this case, the percent of total variance due to the test method is:
There is no hard and fast rule that says a test method should be responsible for some percent of the total variance. In general, to help improve processes, the test method should account for no more than 10% of the total variance.
A precise test method is defined as a test method that is in statistical control with respect to variation (i.e., the range chart) and that is responsible for less than 10% of the total process variance.
The final judge on what makes a test method precise should be the customer.
Step 7: Continue to monitor the accuracy and precision of the test method over time.
The control limits on the chart should be extended into the future. The standard should be run regularly. If any out-of-control situations occur, the reasons should be found and the cause eliminated. Continuous monitoring of the test method will ensure that results are accurate and precise. After 100 standards have been run, the control limits should be recalculated to give better estimates of the averages.
Key test methods should be monitored regularly for accuracy and precision. The key test methods should be selected with input from customers. How often to check the test method depends on how important it is to the customer and how much variation it contributes to the total process variation. If there is too much variation due to the test method, efforts should be made to reduce the amount of common cause variation. If the standard is changed on a regular basis, a deviation from the standard value could be monitored.
X Chart
The X chart for the moisture data is shown above.
mR Chart
The moving range chart for the moisture data is shown above.
Summary
This month’s publication looked at how you can monitor a measurement system by running a standard/control on a regular basis. The results are tracked using an individuals chart. The objective is to bring the measurement system into statistical control. Then you can determine the accuracy and precision of the measurement system. An accurate test method is defined as a test method that is in statistical control with respect to the average of the standard (i.e., the X chart) and the center line of which (Xbar) on the X chart is equal to the true value of the standard. A precise test method is defined as a test method that is in statistical control with respect to variation (i.e., the range chart) and that is responsible for less than 10% of the total process variance.