November 2011
I use control charts whenever I want to look at data over time – if a metric is increasing, decreasing or staying the same. At work, for example, I track our software sales and website visits using a control chart. Doing this allows me to determine when something has significantly improved or decreased. It helps me when there are down months to determine if those months are simply part of the normal variation in the process (and I shouldn’t be too stressed out). The same is true for the up months as well (and that I shouldn’t plan on that extra income each month just due to normal variation).
If you are new to control charts, please check out some of our on-line newsletters about control charts, e.g., our March newsletter of this year on the purpose of control charts.
Yet we seldom think about using control charts outside of work. I wonder why that is. Not surprisingly, I use control charts sometimes outside of work. For example, I have used control charts to track attendance and offerings at my church. You would think there is a positive correlation between those two parameters, but not at my church. There is no correlation. I have used control charts to track my children’s swimming times. I keep thinking about using a control chart to track how long it takes me to walk two miles. But, that means I have to walk two miles to get a data point!
A little less serious topic this month as you may have discerned already. I am a baseball fan. I grew up in Ponca City, Oklahoma listening to the St. Louis Cardinals on WBBZ radio in the early 1960s. Yes, I am that old. My Cardinals won the World Series this year – a very exciting series. Albert Pujols is the first baseman for the Cardinals. He has been with the Cardinals his entire major league career. He is probably the best baseball player in the world today. He is also a free agent this year. This means he can sign with any team that he wants to, so the Cardinals might lose him. And he is looking for a long-term contract and probably would like to be the best paid player in the game. This past season, Pujols made $16 million.
Which brings in Alex Rodriguez. In December 2007, he signed a $275 million, 10-year agreement with the New York Yankees. Wow! This past season, he made about $31 million, about twice as much as Pujols. And he still has six years left on the contract although his salary drops to a paltry $20 million by the last year of his contract.
So, this month, it is Albert Pujols versus Alex Rodriguez. We will answer the following questions using data:
- Albert Pujols is the only player in the game to hit over .300, over 30 home runs and drive in 100 or more runs in 10 consecutive seasons. He did that in his first ten years in the majors, starting in 2001. That streak ended this year. Is Pujols’ productivity declining?
- Alex Rodriguez is baseball’s highest paid player in 2011. He made $31 million, twice as much as Pujols. He has been in the majors since 1994. How do his statistics compare to Pujols?
- Who is the better player offensively?
Let the fun begin! Your comments are welcomed below. Our Quick Links are also listed below.
The Triple Crown of Baseball
Three key statistics for baseball players are batting average (BA), home runs (HR) and runs batted in (RBI). If you are the leader in all three at the end of the season, you are the “triple crown” winner. Carl Yastrzemski was the last person to do this – back in 1967 for the Boston. While there are many other statistics, we will focus on these three in this newsletter.
Albert Pujols
Pujols’ statistics for his first 11 years in the majors are given in the table below for homers (HR), runs batted in (RBI) and batting average (BA). All data is from www.mlb.com.
| Year |
HR |
RBI |
BA |
|
2001 |
37 |
130 |
0.329 |
|
2002 |
34 |
127 |
0.314 |
|
2003 |
43 |
124 |
0.359 |
|
2004 |
46 |
123 |
0.331 |
|
2005 |
41 |
117 |
0.330 |
|
2006 |
49 |
137 |
0.331 |
|
2007 |
32 |
103 |
0.327 |
|
2008 |
37 |
116 |
0.357 |
|
2009 |
47 |
135 |
0.327 |
|
2010 |
42 |
118 |
0.312 |
|
2011 |
37 |
99 |
0.299 |
This past year was a low for Pujols in runs batted in and batting average. He did miss some games due to injury, but that has happened in the past a few times. So, is Pujols’ productivity on a decline? The best way to see this is through the use of control charts. The three control charts for Pujols are shown below with the control limits based on 2001 to 2010. We use the individuals (X-mR) control chart in this newsletter, although we just show the X chart.
Figure 1: Pujols Batting Average
(Limits Based on 2001 – 2010 Data)
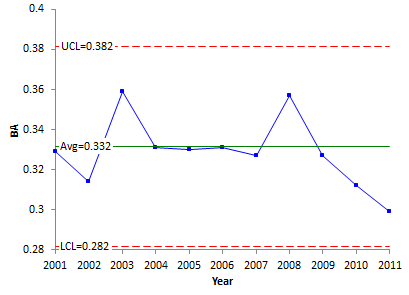
The batting average for 2011 was 0.299. The batting average is simply the number of hits you have divided by the total number of bats you had. You can see that the point is Pujols’ lowest batting average since being in the majors. But, it is within the control limits – part of the normal variation in the process. His batting average is “in control.” You can expect him to bat between .281 and .381 with an average of .333. The last four points in a row trending downward. Cause for concern? Maybe, but still not a signal from the control chart.
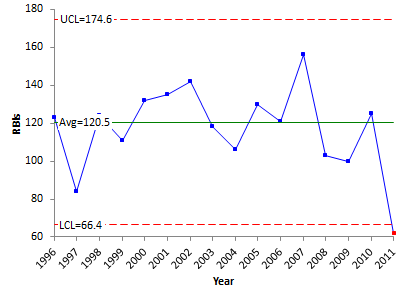
Figure 2: Pujols Runs Batted In
(Limits Based on 2001 – 2010 Data)
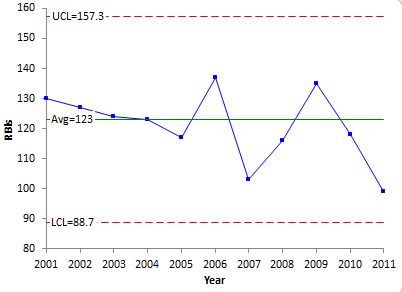
This control chart tells a very similar story to the batting average. His runs batted in for 2011 were the lowest of his career but still within the control limits. His runs batted in are “in control.” You can expect him to drive in anywhere from 88 to 157 runs with an average of 123.
Figure 3: Pujols Home Runs
(Limits Based on 2001 – 2010 Data)
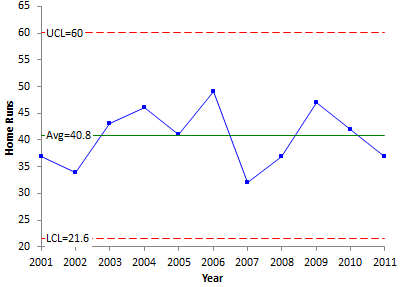
His home run total in 2011 was 37 – not the lowest of his career. This chart is also “in control.” He will hit anywhere from 21 to 60 home runs with an average of about 40.
So, Pujols appears pretty much “in control.” His productivity is not declining. Now, on to Rodriguez.
Alex Rodriguez
Rodriguez has been around since 1994 in the majors, but he didn’t play much during those first two years. His statistics from 1996 are shown in the table below.
Table 2: Alex Rodriguez Statistics
| Year |
HR |
RBI |
BA |
|
1996 |
36 |
123 |
0.358 |
|
1997 |
23 |
84 |
0.300 |
|
1998 |
42 |
124 |
0.310 |
|
1999 |
42 |
111 |
0.285 |
|
2000 |
41 |
132 |
0.316 |
|
2001 |
52 |
135 |
0.318 |
|
2002 |
57 |
142 |
0.300 |
|
2003 |
47 |
118 |
0.298 |
|
2004 |
36 |
106 |
0.286 |
|
2005 |
48 |
130 |
0.321 |
|
2006 |
35 |
121 |
0.29 |
|
2007 |
54 |
156 |
0.314 |
|
2008 |
35 |
103 |
0.302 |
|
2009 |
30 |
100 |
0.286 |
|
2010 |
30 |
125 |
0.270 |
|
2011 |
16 |
62 |
0.276 |
Rodriguez missed quite a few games in 2011 which impacted his statistics for home runs and runs batted in. The control charts for Rodriguez are given below. The time frame from 1996 to 2005 (first ten full years) were used to set the control limits.
Figure 4: Rodriguez Batting Average
(Limits Based on 1996 – 2005 Data)
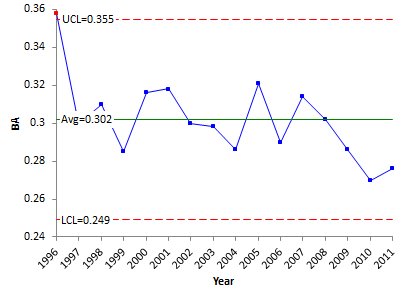
Interesting that in his first full season, Rodriguez hit .358 – out of control on the high side. A special cause of variation! Interesting to guess what caused it to be so high. Any ideas? He has not been close to that average again. Four of his last five years are in a downward trend. But not a signal on the control chart.
(Limits Based on 1996 – 2005 Data)
In 2011, Rodriguez only played in 99 of 162 games so his home runs and runs batted in are down – as seen by the out of control point in 2011 on both charts.
Figure 6: Rodriguez Home Runs
(Limits Based on 1996 – 2005 Data)
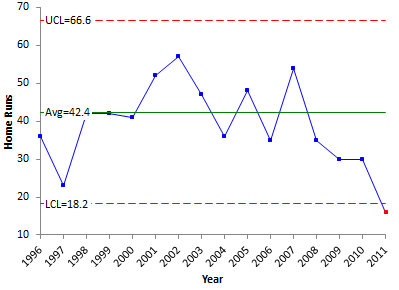
Not considering the past season, Rodriguez seems pretty consistent also. The out of control parts from the past season are due to injuries.
So, Who is Better?
The table below compares the averages from the control charts. Pujols has an edge in batting average and RBIs while Rodriguez has an edge in home runs.
Table 3: Comparison of Averages from Control Charts (Based on 10 Years)
| BA |
RBI |
HR | |
| Pujols |
0.333 | 123 | 40.8 |
| Rodriguez | 0.302 | 120 | 42.4 |
But remember, these averages were based on the first ten years for Pujols and the ten of the first twelve for Rodriguez. One problem is the presence of those special causes – in particular injuries. When a player misses a lot of games, he has fewer opportunities to hit home runs or drive in runs. So, how can we handle this issue?
One method is to look at how many times a player bats before driving in a run or hitting a home run. To calculate this, we simply divide the number of at bats by the runs batted in or by the home runs. The data for both players are given below.
Table 4: Pujols At Bat per Home Run and RBI
| Year | AB | HR | RBI | At Bats per Homer | At Bats per RBI |
| 2001 | 590 | 37 | 130 | 15.95 | 4.54 |
| 2002 | 590 | 34 | 127 | 17.35 | 4.65 |
| 2003 | 591 | 43 | 124 | 13.74 | 4.77 |
| 2004 | 592 | 46 | 123 | 12.87 | 4.81 |
| 2005 | 591 | 41 | 117 | 14.41 | 5.05 |
| 2006 | 535 | 49 | 137 | 10.92 | 3.91 |
| 2007 | 565 | 32 | 103 | 17.66 | 5.49 |
| 2008 | 524 | 37 | 116 | 14.16 | 4.52 |
| 2009 | 568 | 47 | 135 | 12.09 | 4.21 |
| 2010 | 587 | 42 | 118 | 13.98 | 4.97 |
| 2011 | 579 | 37 | 99 | 15.65 | 5.85 |
| Career | 6312 | 445 | 1329 | 14.18 | 4.75 |
Table 5: Rodriguez At Bat per Home Run and RBI
| Year | AB | HR | RBI | At Bats per Homer | At Bats per RBI |
| 1994 | 54 | 0 | 2 | 27.00 | |
| 1995 | 142 | 5 | 19 | 7.47 | 28.40 |
| 1996 | 601 | 36 | 123 | 16.69 | 4.89 |
| 1997 | 587 | 23 | 84 | 25.52 | 6.99 |
| 1998 | 686 | 42 | 124 | 16.33 | 5.53 |
| 1999 | 502 | 42 | 111 | 11.95 | 4.52 |
| 2000 | 554 | 41 | 132 | 13.51 | 4.20 |
| 2001 | 632 | 52 | 135 | 12.15 | 4.68 |
| 2002 | 624 | 57 | 142 | 10.95 | 4.39 |
| 2003 | 607 | 47 | 118 | 12.91 | 5.14 |
| 2004 | 601 | 36 | 106 | 16.69 | 5.67 |
| 2005 | 605 | 48 | 130 | 12.60 | 4.65 |
| 2006 | 572 | 35 | 121 | 16.34 | 4.73 |
| 2007 | 583 | 54 | 156 | 10.80 | 3.74 |
| 2008 | 510 | 35 | 103 | 14.57 | 4.95 |
| 2009 | 444 | 30 | 100 | 14.80 | 4.44 |
| 2010 | 522 | 30 | 125 | 17.40 | 4.18 |
| 2011 | 373 | 16 | 62 | 23.31 | 6.02 |
| Career | 9199 | 629 | 1893 | 14.62 | 4.86 |
Looking at the career numbers, Pujols averages a home run every 14.18 times at bat; Rodriguez every 14.62 times at bat. Pujols averages a run batted in every 4.75 times at bat; Rodriguez every 4.86 times at bat. You could also do control charts on these metrics.
If they both bat 550 times in a typical season, the “expected” home runs and RBIs for each player are given in the table below.
Table 6: “Average” Season for Pujols and Rodriguez
| HR | RBI | |
| Pujols |
39 | 116 |
| Rodriguez | 38 | 113 |
Not much difference that I can see in terms of home runs and RBIs. But Pujols does get the edge on batting average. So, I have to go with Pujols.
Summary
Control charts can and should be used whenever you want to look at how data behaves over time. You can use control charts just about everywhere. This baseball example demonstrates that by using individual control charts to monitor player performance over time. Hope you enjoyed it.
William
this leads nicely on to T tests for significance, is this difference real?
a future article perhaps
Chris
MLB Network just sohewd their top offensive performances in WS history, with Pujols on top of the list. I just don’t see how it’s better than Reggie Jackson’s. Jackson’s 3-HR game was in the deciding Game 6 of the series. His first home run was a 2-run shot that gave the Yankees the lead in the game, going from 3-2 down, to 4-3 up. Then he added the insurance 2-run shot the next inning, making the game 7-3 and all but wrapped up the series. His 3rd home run was just icing on the cake.